THE AUDITORY MODELING TOOLBOX
This documentation page applies to an outdated major AMT version. We show it for archival purposes only.
Click here for the documentation menu and here to download the latest AMT (1.6.0).
data_baumgartner2017looming - - Results from Baumgartner et al. (2017)
Usage
data = data_baumgartner2017looming(dataFlag,measure)
data = data_baumgartner2017looming(fig)
data_baumgartner2017looming provides individually measured HRTFs and experimental results from Baumgartner et al. (2017). Use the fig flag to obtain data shown in figures from Baumgartner et al. (2017).
The dataFlag flag may be used to choose between HRTFs and various experimental results:
| 'hrtf' | HRTFs used in all experiments. |
| 'pretest' | Behavioral results of pre-test. |
| 'exp1' | Behavioral or ERP results of Exp. I. Default. |
| 'exp2' | Behavioral results of Exp. II. |
The measure flag may be one of:
| 'judgment' | Judgment of relative distance change (motion direction). Default. |
| 'rt' | Response time. |
| 'erp' | ERP magnitude measures. |
The fig flag may be one of:
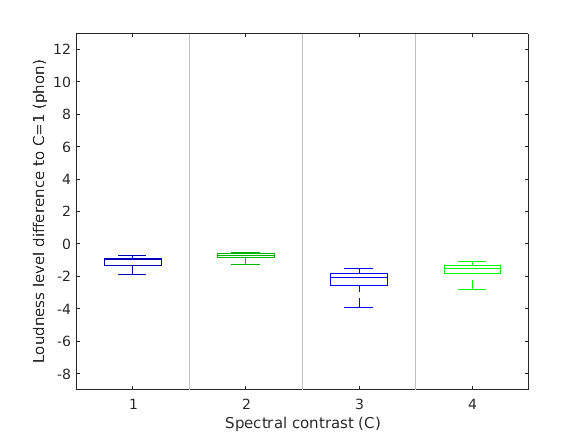
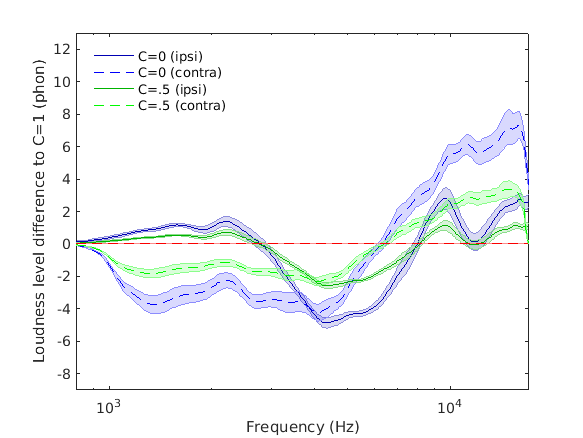
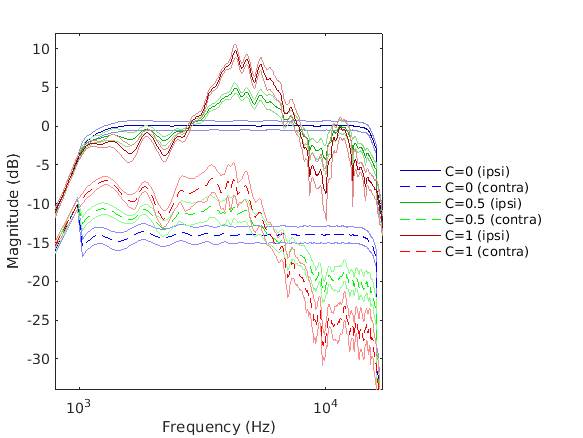
| 'fig1b' | Effect of spectral contrast manipulation according to factor C on magnitude responses of listener-specific stimuli of Exp. I (B, Top) as well as their frequency-specific and overall loudness changes relative to C = 1. Shaded areas denote ??1 standard error of the mean (SEM; N = 15). Note that changes in overall loudness oppose the intended effect of contrast switch. |
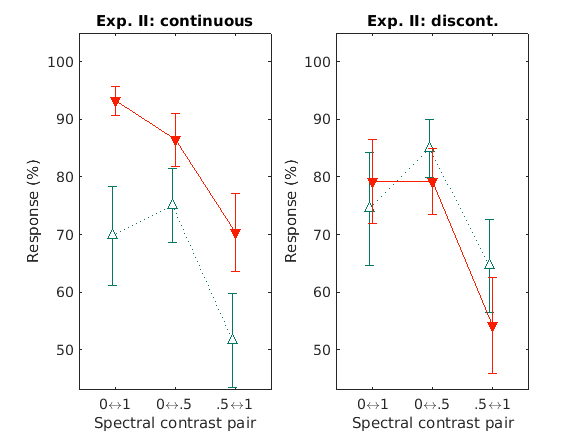
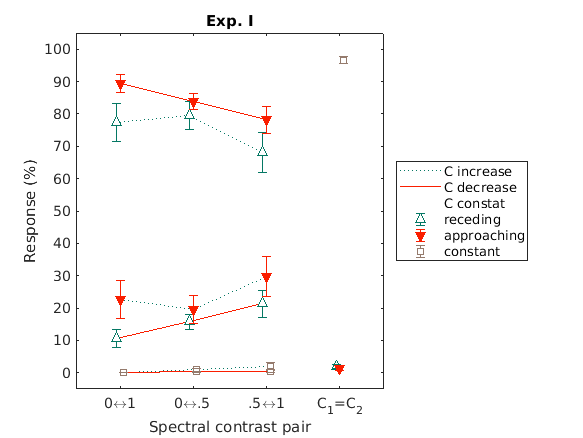
| 'fig2' | Behavioral responses were more consistent for sounds perceived as approaching compared to sounds perceived as receding if instantaneous spectral changes were presented in continuous stimuli. Mean behavioral responses in the 3?AFC motion discrimination task of Exp. I (fist figure; N = 15) and the 2?AFC motion discrimination task of Exp. II (second figure; N = 13). Results of Exp. II are separated between trials presenting instantaneous but continuous (Left; as in Exp. I) and discontinuous (Right) spectral contrast switches. Decreasing spectral contrast switches (orange lines) were predominantly perceived as approaching (orange triangles), increasing spectral contrast switches (green lines) as receding (green triangles), and constant spectral contrasts (no lines) as static (gray squares). Statistical analyses focused on these predominant response associations. Values reflect mean ??1 SEM. |
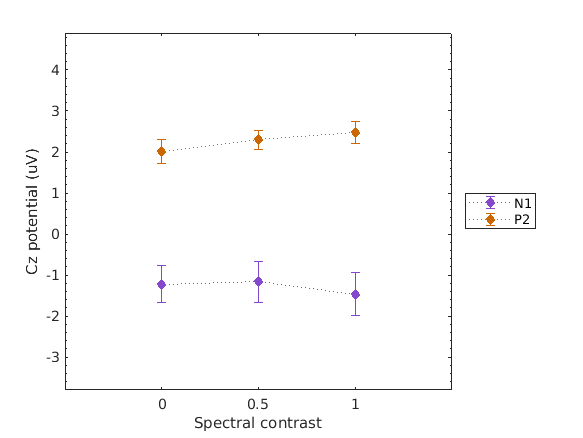
| 'fig3a' | Extracted N1 and P2 amplitudes evoked by stimulus onset. Error bars reflect SEM. |
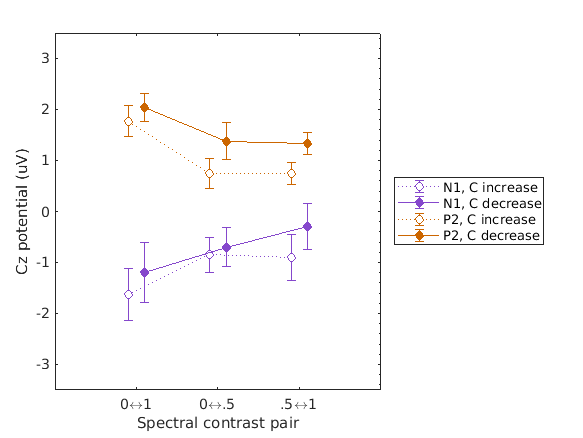
| 'fig3b' | Extracted N1 and P2 amplitudes evoked by stimulus switch. Error bars reflect SEM. |
| 'fig3c' | Significant cluster in time and space that is distinctive between decreasing and increasing spectral contrasts. (no plotting) |
Additional flags may be:
| 'plot' | Plot results as published. |
| 'noplot' | No plots. Default. |
| 'stat' | Analyze and display inferential statistics. |
| 'nostat' | No statistics. Default. |
| 'onset' | To use onset ERPs. |
| 'switch' | To use switch-ERPs. Default. |
Output parameters
| '',data | structure that contains either HRTFs (id, and Obj) or experimental results including raw and averaged data (rawData,`data`, opional meta information). Statisitcs (stat) and figure handles (fig) are provided if requested. |
Requirements:
- SOFA API v0.4.3 or higher from http://sourceforge.net/projects/sofacoustics for Matlab (in e.g. thirdparty/SOFA)
- Data in hrtf/baumgartner2017looming and auxdata/baumgartner2017looming (downloaded on the fly)
- Statistics Toolbox for Matlab (for some fig)
Examples:
To display results of Fig.1B
data_baumgartner2017looming('fig1b','plot');
To display results of Fig.2
data_baumgartner2017looming('fig2','plot');
This code produces the following output:
Exp. I:
                                   F        pValueGG      DFGG     eta_pSq
                                 ______    __________    ______    _______

    (Intercept)                  424.57    7.1759e-12         1    0.96808
    Error                                                    14        NaN
    contrast                     14.676    0.00034947    1.4409    0.51178
    Error(contrast)                                      20.172        NaN
    direction                    6.8776      0.020077         1    0.32943
    Error(direction)                                         14        NaN
    contrast:direction           1.9649       0.17086    1.5473    0.12307
    Error(contrast:direction)                            21.663        NaN

    contrast_1    contrast_2    Difference    StdErr      pValue       Lower      Upper
    __________    __________    __________    ______    __________    _______    _______

    '.5-1'        '0-.5'        -8.6389       2.5048      0.010235    -15.195    -2.0832
    '.5-1'        '0-1'         -10.278       2.0939    0.00063233    -15.758    -4.7975
    '0-.5'        '.5-1'         8.6389       2.5048      0.010235     2.0832     15.195
    '0-.5'        '0-1'         -1.6389       1.3446       0.46196    -5.1581     1.8803
    '0-1'         '.5-1'         10.278       2.0939    0.00063233     4.7975     15.758
    '0-1'         '0-.5'         1.6389       1.3446       0.46196    -1.8803     5.1581

Exp. II:
Subject S09 identified as outlier and removed from further analyses.
                                           F        pValueGG      DFGG     eta_pSq
                                        _______    __________    ______    ________

    (Intercept)                           186.8    3.0216e-08         1     0.94439
    Error                                                            11         NaN
    contrast                             36.152    1.7995e-07    1.9275     0.76671
    Error(contrast)                                              21.203         NaN
    direction                            3.5166      0.087534         1     0.24225
    Error(direction)                                                 11         NaN
    ISInom                              0.30113       0.59414         1    0.026646
    Error(ISInom)                                                    11         NaN
    contrast:direction                  0.94707       0.38299     1.504    0.079272
    Error(contrast:direction)                                    16.544         NaN
    contrast:ISInom                     0.61794       0.52893    1.7533    0.053189
    Error(contrast:ISInom)                                       19.286         NaN
    direction:ISInom                     14.572     0.0028564         1     0.56984
    Error(direction:ISInom)                                          11         NaN
    contrast:direction:ISInom            1.1054       0.33592     1.469    0.091316
    Error(contrast:direction:ISInom)                             16.159         NaN

    contrast_1    contrast_2    Difference    StdErr      pValue       Lower      Upper
    __________    __________    __________    ______    __________    _______    _______

    '.5-1'        '0-.5'        -21.224       2.9324    4.5609e-05    -29.144    -13.304
    '.5-1'        '0-1'          -19.01       2.4768    2.6456e-05      -25.7    -12.321
    '0-.5'        '.5-1'         21.224       2.9324    4.5609e-05     13.304     29.144
    '0-.5'        '0-1'          2.2135       2.8034       0.71681     -5.358     9.7851
    '0-1'         '.5-1'          19.01       2.4768    2.6456e-05     12.321       25.7
    '0-1'         '0-.5'        -2.2135       2.8034       0.71681    -9.7851      5.358
To display results of Fig.3A
data_baumgartner2017looming('fig3a','plot');
To display results of Fig.3B
data_baumgartner2017looming('fig3b','plot');
References:
R. Baumgartner, D. K. Reed, B. Tóth, V. Best, P. Majdak, H. S. Colburn, and B. Shinn-Cunningham. Asymmetries in behavioral and neural responses to spectral cues demonstrate the generality of auditory looming bias. Proceedings of the National Academy of Sciences, 2017. [ DOI | arXiv | http ]


Build with Bootstrap