THE AUDITORY MODELING TOOLBOX
This documentation page applies to an outdated major AMT version. We show it for archival purposes only.
Click here for the documentation menu and here to download the latest AMT (1.6.0).
EXP_BAUMGARTNER2013 - Figures from Baumgartner et al. (2013)
Usage
data = exp_baumgartner2013(flag)
Description
exp_baumgartner2013(flags) reproduces figures of the book chapter from Baumgartner et al. (2013).
Optional fields of output data structure:
- data.id
- listener ID
- data.u
- listener-specific uncertainty
- data.dtfs
- matrix containing DTFs. Dimensions: time, position, channel (more details see doc: HRTF format)
- data.fs
- sampling rate of impulse responses
- data.pos
- source-position matrix referring to 2nd dimension of hM and formated acc. to meta.pos (ARI format). 6th col is the lateral angle. 7th col is the polar angle.
- data.spdtfs
- DTFs of specific SPs
- data.polangs
- polar angles corresponding to data.spdtfs
- data.pmv
- predicted polar angular response PMVs
- data.respangs
- polar response angules corresponding to data.p
- data.pe
- predicted local polar RMS error in degrees
- data.qe
- predicted quadrant error
The following flags can be specified:
| 'plot' | Plot the output of the experiment. This is the default. |
| 'noplot' | Don't plot, only return data. |
| 'fig12' | Reproduce Fig. 12: DTFs of median SP (left ear). Left: NH12. Center: NH58. Right: NH33. Brightness: Spectral magnitude. |
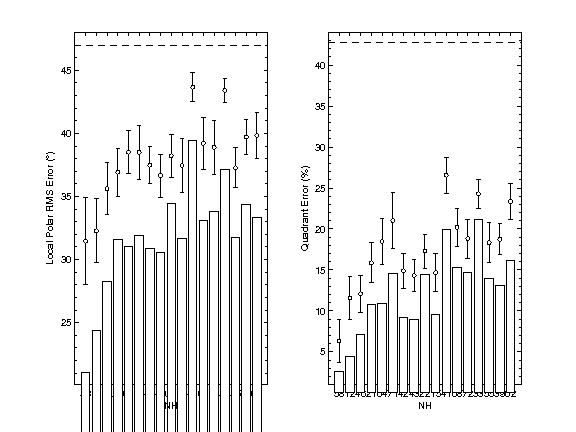
| 'fig13' | Reproduce Fig. 13: Listener's localization performance for non-individualized versus individualized DTFs. Bars: Individualized DTFs. Circles: Non-individualized DTFs averaged over 16 DTF sets. Error bars: ±1 standard deviation of the average. Horizontal line: Chance performance corresponding to guessing the direction of the sound. |
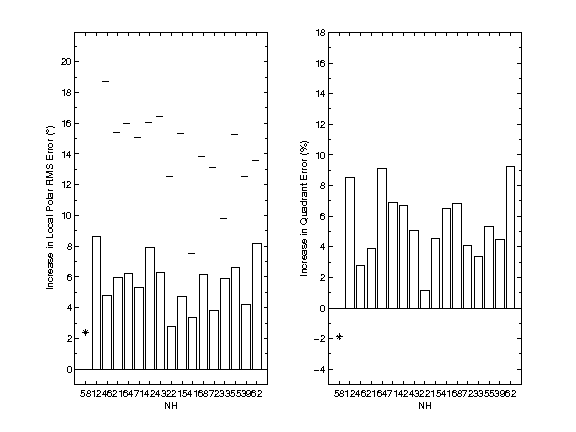
| 'fig14' | Reproduce Fig. 14: Bars: Increase in localization errors when listening to a binaural recording created with the DTFs from NH58. Asterisk: Difference between actual (experiment) and predicted performance when listening to individualized DTFs. Horizontal lines: chance performance corresponding to guessing the direction of the sound. |
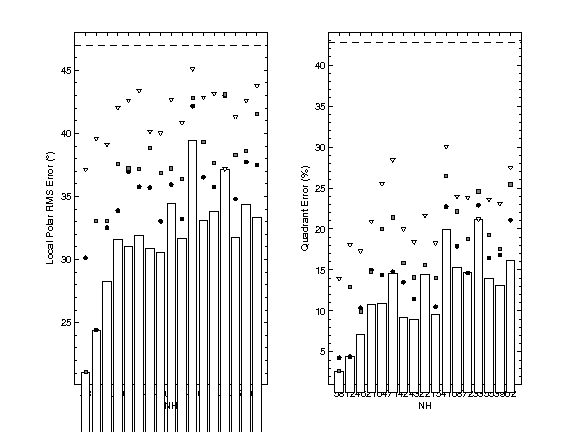
| 'fig15' | Reproduce Fig. 15: Bars: Localization performance of the pool listening to selected DTFs. Circles: DTFs from NH12. Squares: DTFs from NH58. Triangles: DTFs from NH33. |
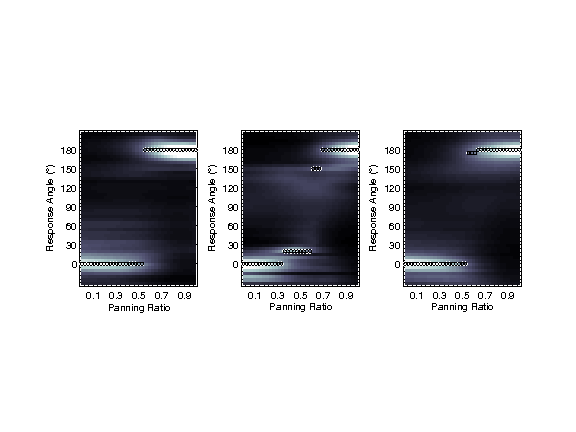
| 'fig18' | Reproduce Fig. 18: Predicted response probabilities (PMVs) as a function of the amplitude panning ratio between a rear and a front loudspeaker in the same SP (lateral angle: 30 deg.). Left: Results for NH12. Center: Results for NH15. Right: Results for our pool of listeners. Circle: Maximum of a PMV. Panning ratio of 0: Only front loudspeaker active. Panning ratio of 1: Only rear loudspeaker active. |
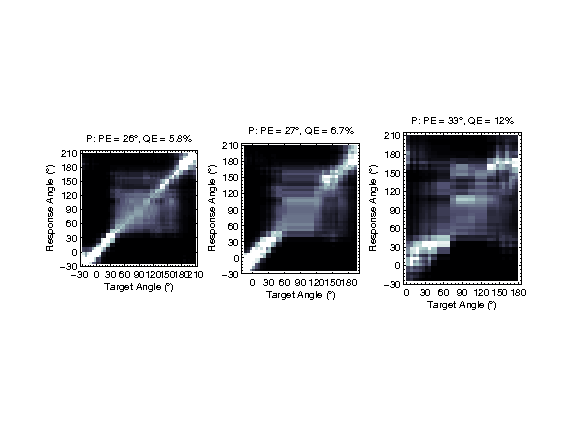
| 'fig19' | Reproduce Fig. 19: Prediction matrices (PMVs) for different loudspeaker spans and NH12. Left: Span of 0 deg. (single-loudspeaker reproduction, baseline). Center: Span of 30 deg. Right: Span of 60 deg. P: Predicted performance. |
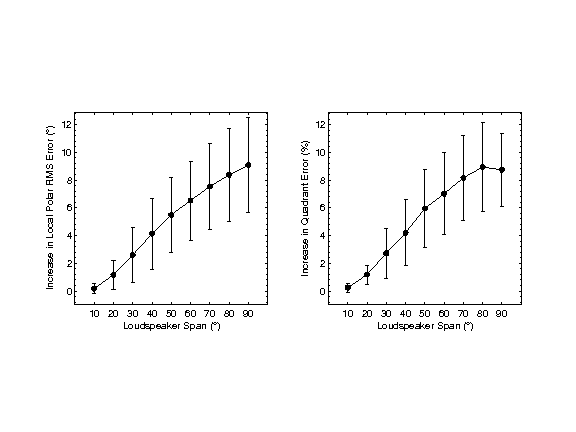
| 'fig20' | Reproduce Fig. 20: Increase in localization errors as a function of the loudspeaker span. Circles: Averages over all listeners from the pool. Error bars: +/- 1 standard deviation of the averages. |
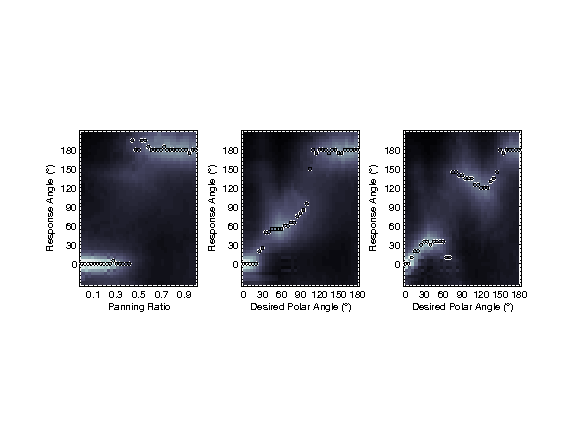
| 'fig22' | Reproduce Fig. 22: Predictions for the surround setups in the VBAP configuration. Left: 5.1 setup, panning between the loudspeakers L and LS. Center: 10.2 setup (DSX), panning from L (polar angle of 0 deg.) via LH2 (55 deg.) to LS (180 deg.) Right: 9.1 setup (Auro-3D), panning from L (0 deg.) via LH1 (34 deg.) and LSH (121 deg.) to LS (180 deg.). Desired polar angle: Continuous scale representing the VBAP across pair-wise contributing loudspeakers. All other conventions as in Fig. 18. |
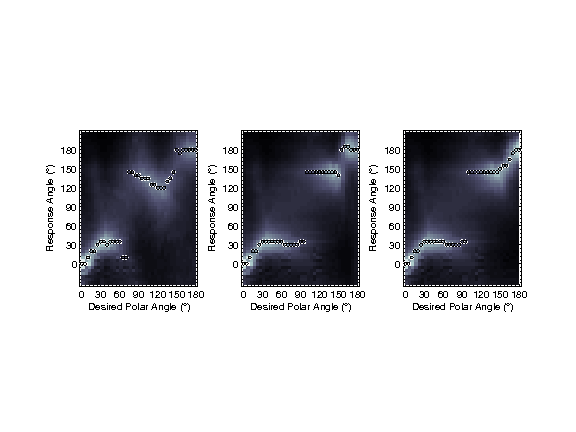
| 'fig23' | Reproduce Fig. 23: Predictions for two modifications to the 9.1 setup (Auro 3D). Left: Original setup, loudspeakers LS and LSH at the azimuth of 110 deg. Center: LSH at the azimuth of 130 deg. Right: LS and LSH at the azimuth of 130 deg. All other conventions as in Fig. 22. |
Requirements:
- SOFA API v0.4.3 or higher from http://sourceforge.net/projects/sofacoustics for Matlab (in e.g. thirdparty/SOFA)
- Data in hrtf/baumgartner2013
Examples:
To display Fig. 12 use
exp_baumgartner2013('fig12');
To display Fig. 13 use
exp_baumgartner2013('fig13');
To display Fig. 14 use
exp_baumgartner2013('fig14');
To display Fig. 15 use
exp_baumgartner2013('fig15');
To display Fig. 18 use
exp_baumgartner2013('fig18');
To display Fig. 19 use
exp_baumgartner2013('fig19');
To display Fig. 20 use
exp_baumgartner2013('fig20');
To display Fig. 22 use
exp_baumgartner2013('fig22');
To display Fig. 23 use
exp_baumgartner2013('fig23');
References:
R. Baumgartner. Modeling sagittal-plane sound localization with the application to subband-encoded head related transfer functions. Master's thesis, University of Music and Performing Arts, Graz, June 2012. [ .pdf ]
R. Baumgartner, P. Majdak, and B. Laback. Assessment of Sagittal-Plane Sound Localization Performance in Spatial-Audio Applications, chapter 4, page expected print date. Springer-Verlag GmbH, accepted for publication, 2013.


Build with Bootstrap