THE AUDITORY MODELING TOOLBOX
This documentation page applies to an outdated major AMT version. We show it for archival purposes only.
Click here for the documentation menu and here to download the latest AMT (1.6.0).
EXP_LOPEZPOVEDA2001 - Figures from Lopez-Poveda and Meddis (2001)
Usage
output = exp_lopezpoveda2001(flag)
Description
exp_lopezpoveda2001(flags,... ) reproduces experiments from the Lopez & Poveda (2001) paper.
The following flags can be specified;
| 'plot' | Plot the output of the experiment. This is the default. |
| 'noplot' | Don't plot, only return data. |
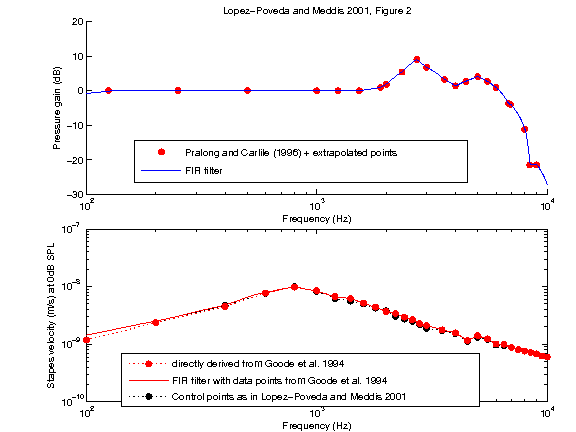
| 'fig2' | Reproduce Fig. 2 from Lopez & Poveda (2001) Fig. 2a represents the outer ear filter - pressure gain (dB) over frequency with data points from Pralong and Carlile (1996). Fig. 2b represents the middle ear filter - stapes velocity at 0dB over frequency in one plot Fig. 2b shows for default \(fs = 22050 Hz\) :
The dimensions of the output are: frequency values x data points x figure no. |
| 'fig2a' | Reproduce just Fig. 2a. |
| 'fig2b' | Reproduce just Fig. 2b. |
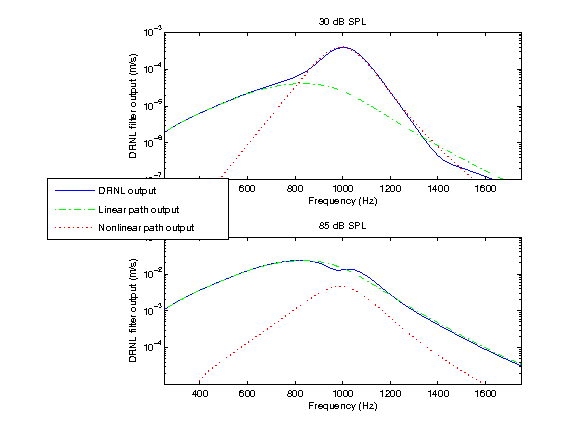
| 'fig3bc' | Reproduce Fig. 3b and c from Lopez & Poveda (2001). Isointensity response of the linear, nonlinear and summed response of the DRNL filter for an input level of 30dB (fig 3b) and 85dB (fig 3c) SPL The output is the output of the DRNL filter for the different input levels. The dimensions of the output are: input frequency x [frequency values, linear output, nonlinear output, summed DRNL output] x input level. |
| 'fig3b' | Reproduce just Fig. 3b. |
| 'fig3c' | Reproduce just fig. 3c. |
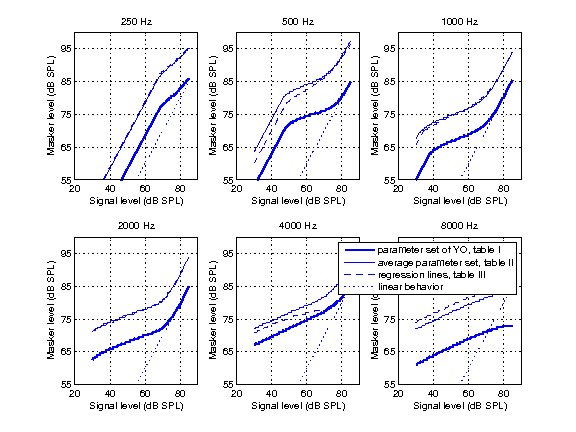
| 'fig4' | Reproduce Fig. 4 from Lopez & Poveda (2001) - pulsation threshold data (just the model results, not the experimental data) The output is the model result for the different parameter sets. The dimensions of the output are: signal level x masker level x signal frequency masker level consists of 4 columns:
|
Examples:
To display Figure 2 use
exp_lopezpoveda2001('fig2');
To display Figure 3b and 3c use
exp_lopezpoveda2001('fig3bc');
To display Figure 4 use
exp_lopezpoveda2001('fig4');
References:
R. Goode, M. Killion, K. Nakamura, and S. Nishihara. New knowledge about the function of the human middle ear: development of an improved analog model. The American journal of otology, 15(2):145-154, 1994.
E. Lopez-Poveda and R. Meddis. A human nonlinear cochlear filterbank. J. Acoust. Soc. Am., 110:3107-3118, 2001.
D. Pralong and S. Carlile. The role of individualized headphone calibration for the generation of high fidelity virtual auditory space. J. Acoust. Soc. Am., 100:3785-3793, 1996.


Build with Bootstrap