THE AUDITORY MODELING TOOLBOX
This documentation page applies to an outdated major AMT version. We show it for archival purposes only.
Click here for the documentation menu and here to download the latest AMT (1.6.0).
EXP_BAUMGARTNER2016 - evaluation of baumgartner2016 model
Usage
data = exp_baumgartner2016(flag)
exp_baumgartner2016(flag) reproduces figures of the study from Baumgartner et al. (2014).
The following flags can be specified
| 'plot' | Plot the output of the experiment. This is the default. |
| 'noplot' | Don't plot, only return data. |
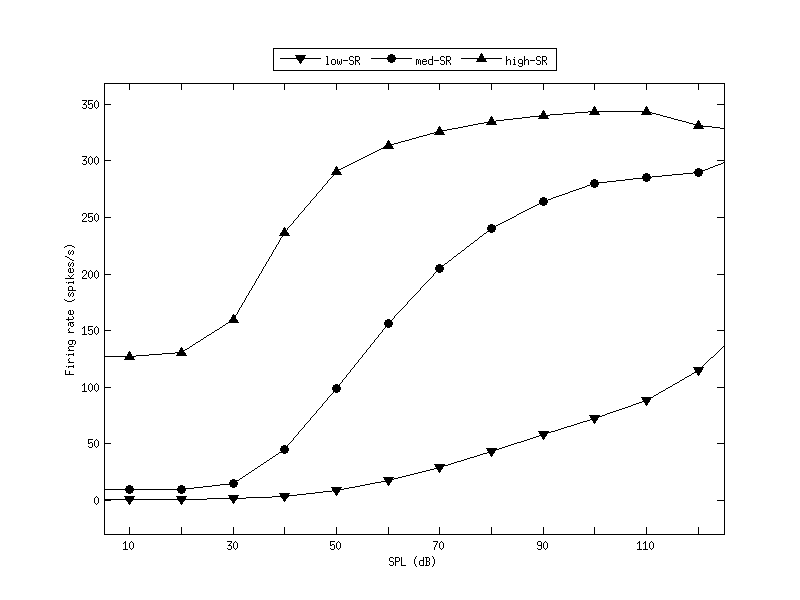
| 'fig2' | or 'ratelevelcurves' Rate-level curves of the three different fiber types represented in the auditory-periphery model. Firing rates were evaluated at a CF of 4 kHz in response to Gaussian white noise at various SPLs. Note that high-SR fibers saturate already at low SPLs, medium-SR fibers at moderate SPLs, and low-SR fibers not at all. |
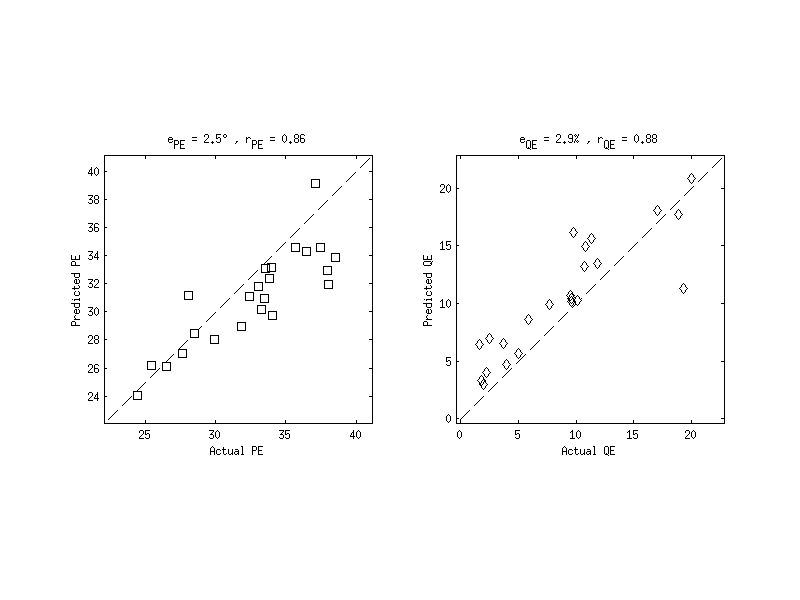
| 'fig3' | or 'baseline' Correspondence between actual and predicted baseline performance for the 23 normal-hearing listeners after listener-specific calibration of the models sensitivity parameter (S). |
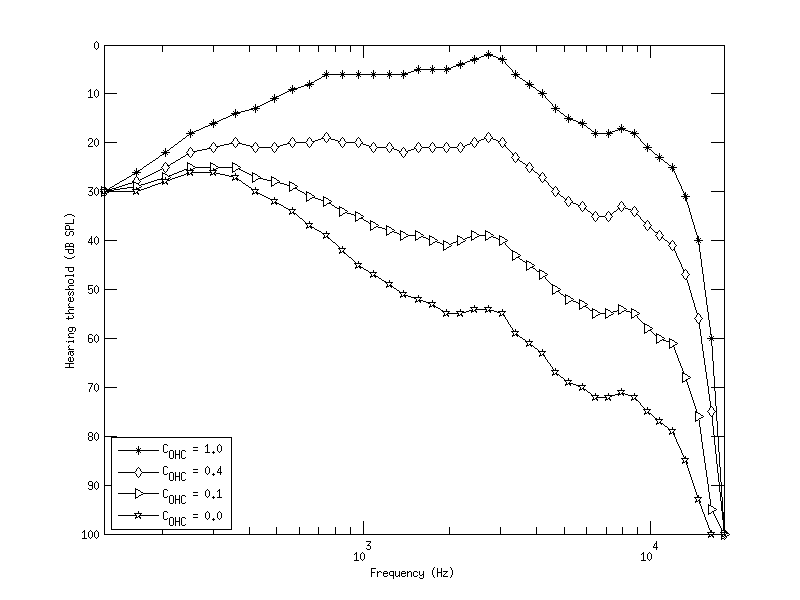
| 'fig4' | or 'tab1 or 'hearingthreshold' Hearing thresholds estimated for simulated OHC gains (COHC) within the range of 1 (normal active cochlea) to 0 (passive cochlea). The selected set of OHC gains results in approximately equal increments of high-frequency thresholds. Table I: Simulated Conditions of OHC Dysfunction, Estimated PTAs, and Corresponding Hearing Loss Categories. |
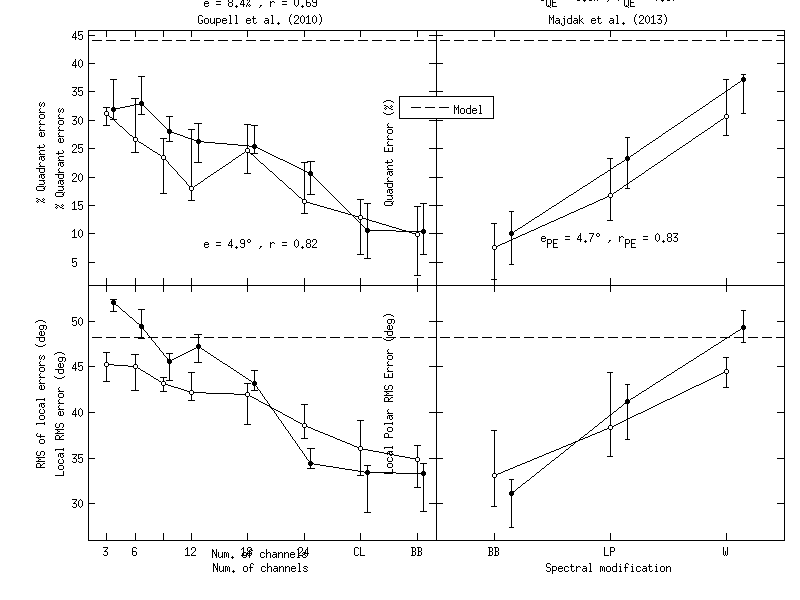
| 'fig5' | or 'numchan and 'spatstrat' Model evaluation for normal-hearing listeners tested on the effects of spectral resolution (by number of vocoder channels in Goupell et al., 2010) and spectral warping (Majdak, Walder, et al., 2013). Model data (filled circles) are compared with actual data (open circles) from the two studies. Error bars represent SDs. Symbols are slightly shifted along the abscissa for better visibility. BB = broadband noise burst; CL = broadband click train (infinite number of channels); LP = low-pass filtered at 8.5 kHz; W = HRTFs spectrally warped from 2.8 to 16 kHz to 2.8 to 8.5 kHz. |
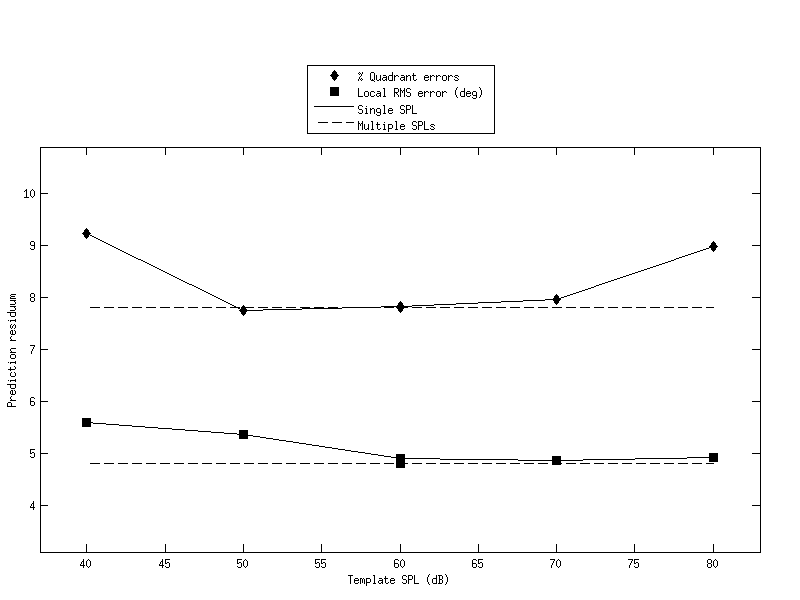
| 'fig6' | or 'evalSPLtem' Effect of template SPL on predictive power of the model for the two studies (Goupell et al., 2010; Majdak, Walder, et al., 2013) shown in Figure 5. Predictions based on a single template SPL equivalent to the actual SPL of the target sounds of 60 dB result in similar prediction residues as based on templates mixed across a broad range of SPLs. Higher plausibility of the mixed-SPL templates was the reason to choose this representation for all further simulations (including predictions shown in Figure 5). |
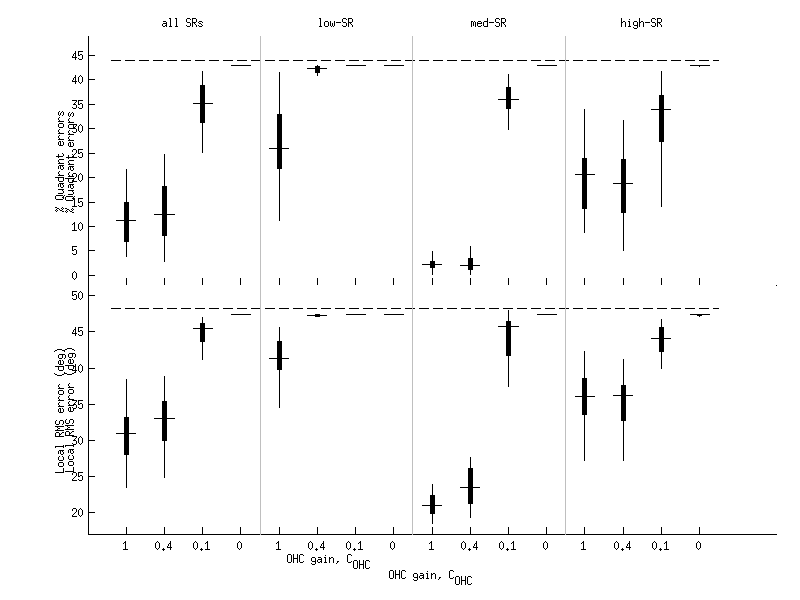
| 'fig7' | or 'impairment' Effects of OHC dysfunctions and selective activity of AN fibers on predicted quadrant error rates (top) and local RMS errors (bottom). Thick bar: interquartile range (IQR). Thin bar: data range within 1.5 IQR. Horizontal line within thick bar: average. Dashed horizontal line: chance performance. |
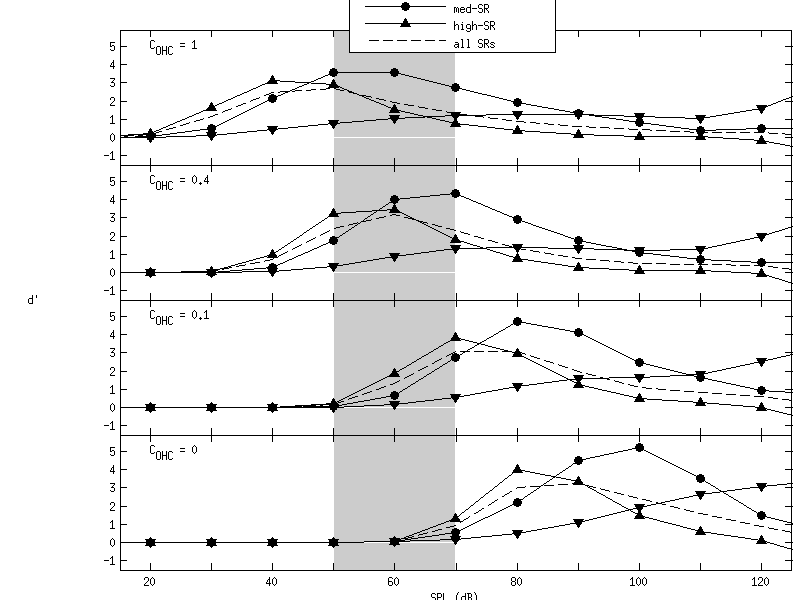
| 'fig8' | or 'sensitivity' Sensitivity (dprime) of AN fibers in level discrimination as function of SPL predicted for different fiber types and OHC dysfunctions. Sensitivities were evaluated for SPL increments of 10 dB and averaged across 28 CFs from 0.7 to 18 kHz. Gray area: stimulus range of target sounds at 60 dB SPL. |
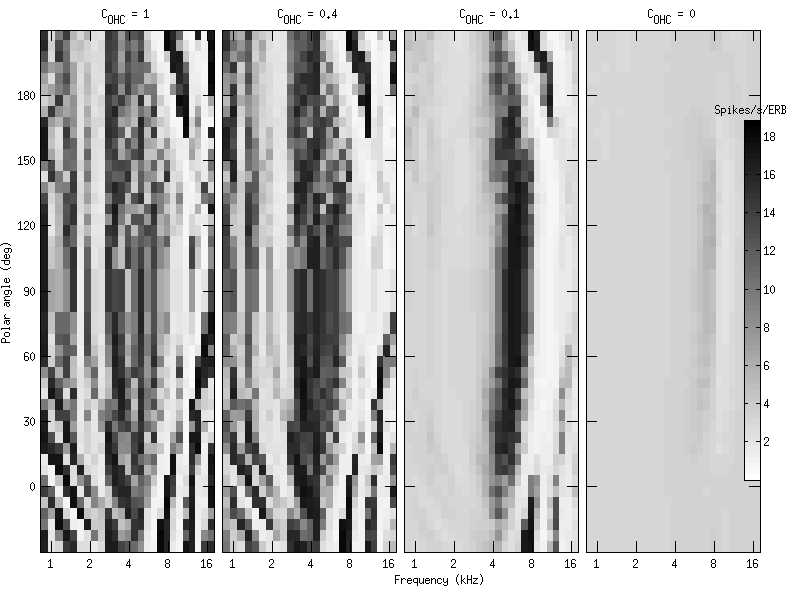
| 'fig9' | or 'effectOnCues' Effect of OHC dysfunction on positive spectral gradients. Exemplary median-plane HRTFs from one listener (NH46). Note the distinct direction-specific patterns for the normal and moderate OHC dysfunctions (COHC>=0.4), which are almost absent in the cases of the severe and complete OHC dysfunctions (COHC<=0.1). |
- 'baseline_ex''
- Prediction examples. Actual responses and response predictions for three exemplary listeners when listening to median-plane targets in the baseline condition. Actual response angles are shown as open circles. Probabilistic response predictions are encoded by brightness according to the color bar to the right. Actual (A:) and predicted (P:) quadrant error rates (QE) and local polar RMS errors (PE) are listed above each panel.
- 'spatstrat_ex''
- Effect of band limitation and spectral warping. Actual responses and response predictions for listener NH12 when listening to broadband (BB), low-pass filtered (LP), or spectrally warped (W) DTFs of the median plane. Data were pooled within \(\pm15^\circ\) of lateral angle.
- 'numchan_ex''
- Effect of spectral resolution in terms of varying the number of spectral channels of a channel vocoder. Actual responses and response predictions for exemplary listener NH12. Results for 24, 9, and 3 channels are shown. All other conventions are as in Fig.3.
Requirements:
- SOFA API v0.4.3 or higher from http://sourceforge.net/projects/sofacoustics for Matlab (in e.g. thirdparty/SOFA)
- Data in hrtf/baumgartner2014
- Statistics Toolbox for Matlab (for some of the figures)
Examples:
To display the rate-level curves use
exp_baumgartner2016('fig2');
To display the baseline prediction use
exp_baumgartner2016('fig3');
This code produces the following output:
Corr. QE: 0.88 (p = 0.000), PE: 0.86 (p = 0.000), QE+PE: 0.87
To display estimations of hearing thresholds use
exp_baumgartner2016('fig4');
This code produces the following output:
PTAlow_Rakerd98 PTAhigh_Rakerd98 PTAhigh_Otte13

PTA =

    14    17    16
    28    37    37
    37    53    54
To display model evaluation for normal-hearing listeners use
exp_baumgartner2016('fig5');
To display evaluation results for template SPL use
exp_baumgartner2016('fig6');
This code produces the following output:
Predictive power for SpatStrat and NumChan.
To display predicted effects of sensorineural hearing loss use (requires Matlab 2013b or higher)
exp_baumgartner2016('fig7');
To display sensitivity evaluation for different fiber types use
exp_baumgartner2016('fig8');
This code produces the following output:
Correlation between dprime and quadrant errors:
    r: -0.9218
    p: 3.8903e-07

Correlation between dprime and local RMS errors:
    r: -0.9042
    p: 1.5336e-06
To display effect of OHC damage on exemplary spectral cue representation use
exp_baumgartner2016('fig9');
This code produces the following output:
Exemplary listener: NH46
References:
R. Baumgartner, P. Majdak, and B. Laback. Modeling the effects of sensorineural hearing loss on auditory localization in the median plane. Trends in Hearing, 20:1-11, 2016. [ DOI ]
P. Majdak, T. Walder, and B. Laback. Effect of long-term training on sound localization performance with spectrally warped and band-limited head-related transfer functions. J. Acoust. Soc. Am., 134:2148-2159, 2013.
M. J. Goupell, P. Majdak, and B. Laback. Median-plane sound localization as a function of the number of spectral channels using a channel vocoder. J. Acoust. Soc. Am., 127:990-1001, 2010.


Build with Bootstrap