THE AUDITORY MODELING TOOLBOX
This documentation page applies to an outdated AMT version (1.1.0). Click here for the most recent page.
DATA_LINDEMANN1986 - Data points from the Lindemann (1986a) paper
Usage
data = data_lindemann1986_data(flag)
Output parameters
| data | the data points from the given figure as a matrix with x and y data or (in cases where no clear x values were given such as T/2) as a vector containing only the y data |
Description
data_lindemann1986(flag) returns data points from the Lindemann 1986 paper. The flag may be one of:
| 'no_plot' | Don't plot, only return data. This is the default. |
| 'plot' | Plot the data. |
| 'fig11_yost' | Return data from Fig. 11. with condition "yost". The data is ILD vs. lateral displacement (10 is max Displacement). |
| 'fig11_sayers' | Return data from Fig. 11. with condition "sayers". The data is ILD vs. lateral displacement (10 is max displacement). |
| 'fig12_400' | Return data from Fig. 12. for the 400 Hz pure tone. The data is ILD vs. ITD. |
| 'fig12_600' | Return data from Fig. 12. for the 600 Hz pure tone. The data is ILD vs. ITD. |
| 'fig13' | Return data from Fig. 13. The output data format is x-axis, -3dB, 3dB, 9dB, 15dB, 25dB. The data is ILD vs. ITD. |
| 'fig16' | Return data from Fig. 16. The data is ILD vs. ITD. |
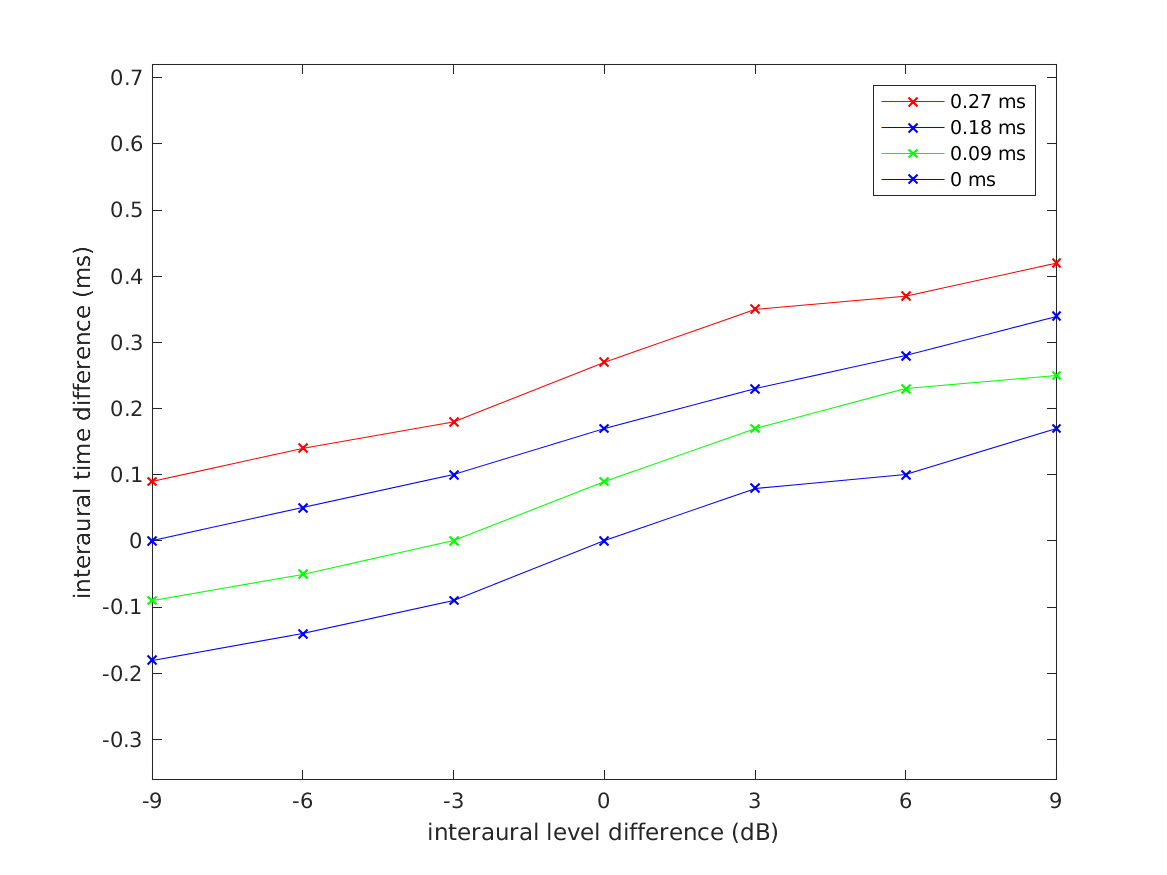
| 'fig17' | Return data from Fig. 17. The output data format is x-axis, 0ms, 0.09ms, 0.18ms, 0.27ms. The data is ITD vs. ILD. |
If no flag is given, the function will print the list of valid flags.
Examples:
Figure 11 with the "yost" condition can be displayed using
data_lindemann1986('fig11_yost','plot');
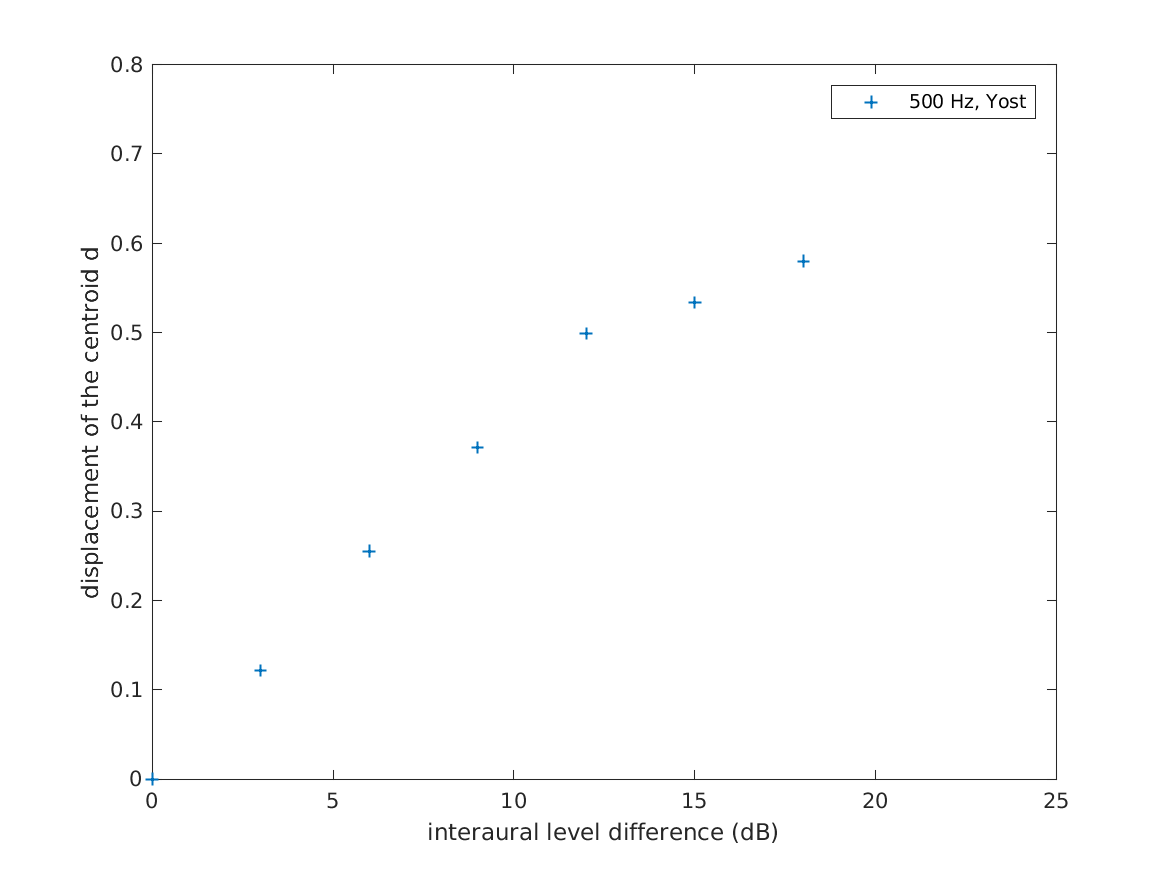
Figure 11 with the "sayers" condition can be displayed using
data_lindemann1986('fig11_sayers','plot');
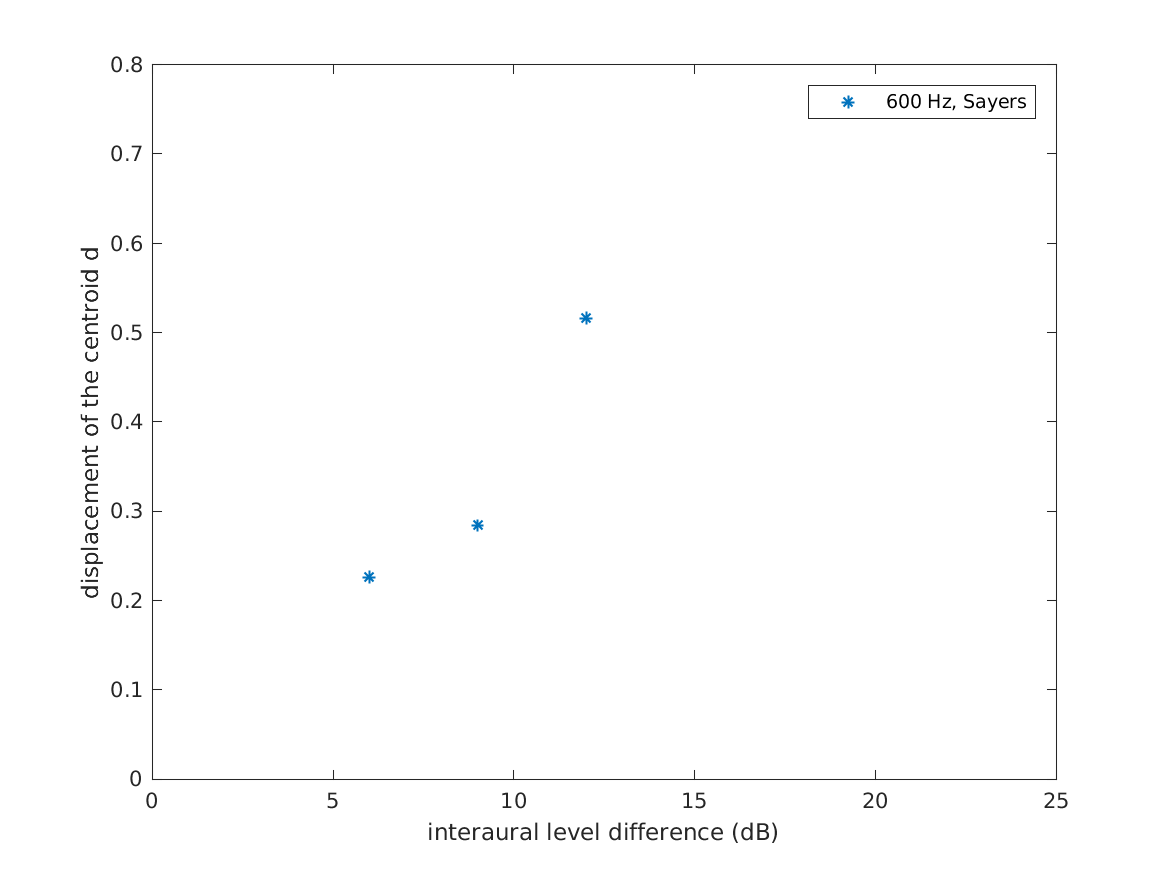
Figure 12 for a 400 Hz pure tone can be displayed using
data_lindemann1986('fig12_400','plot');
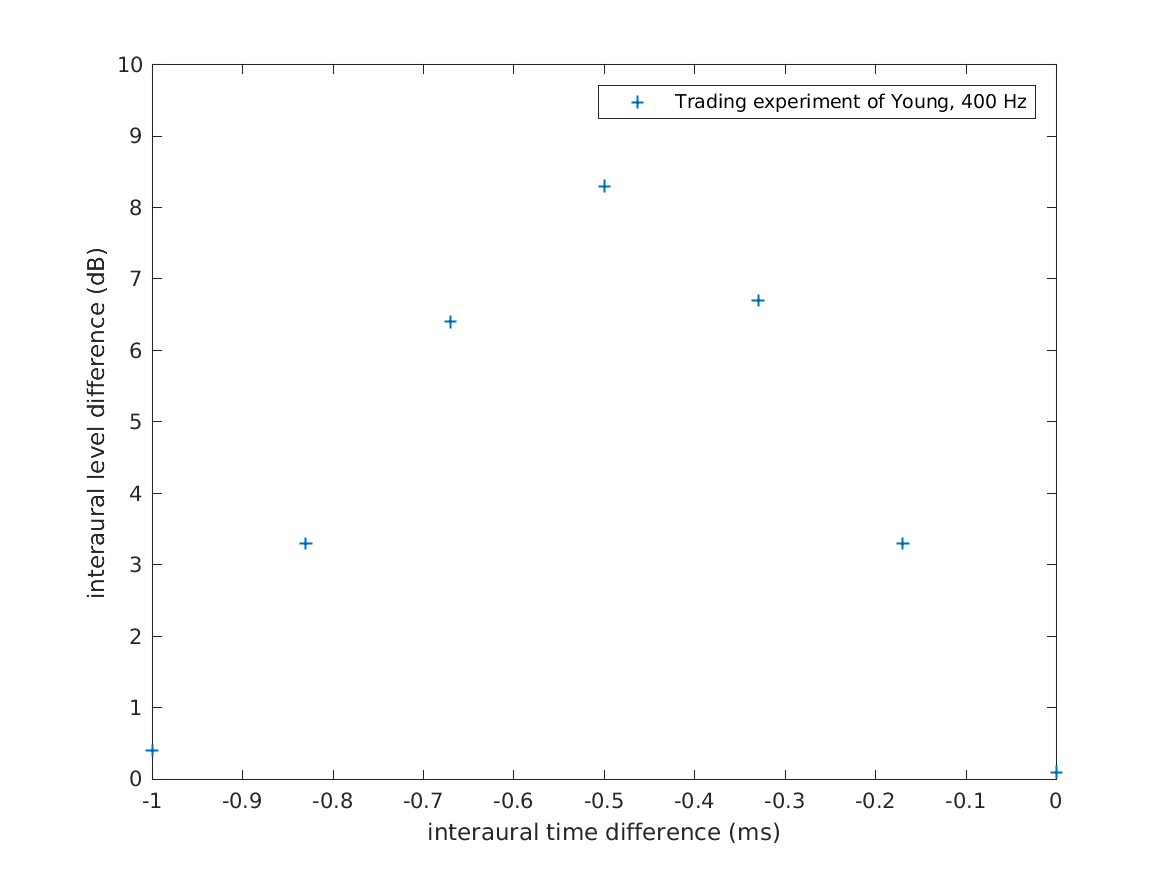
Figure 12 for a 600 Hz pure tone can be displayed using
data_lindemann1986('fig12_600','plot');
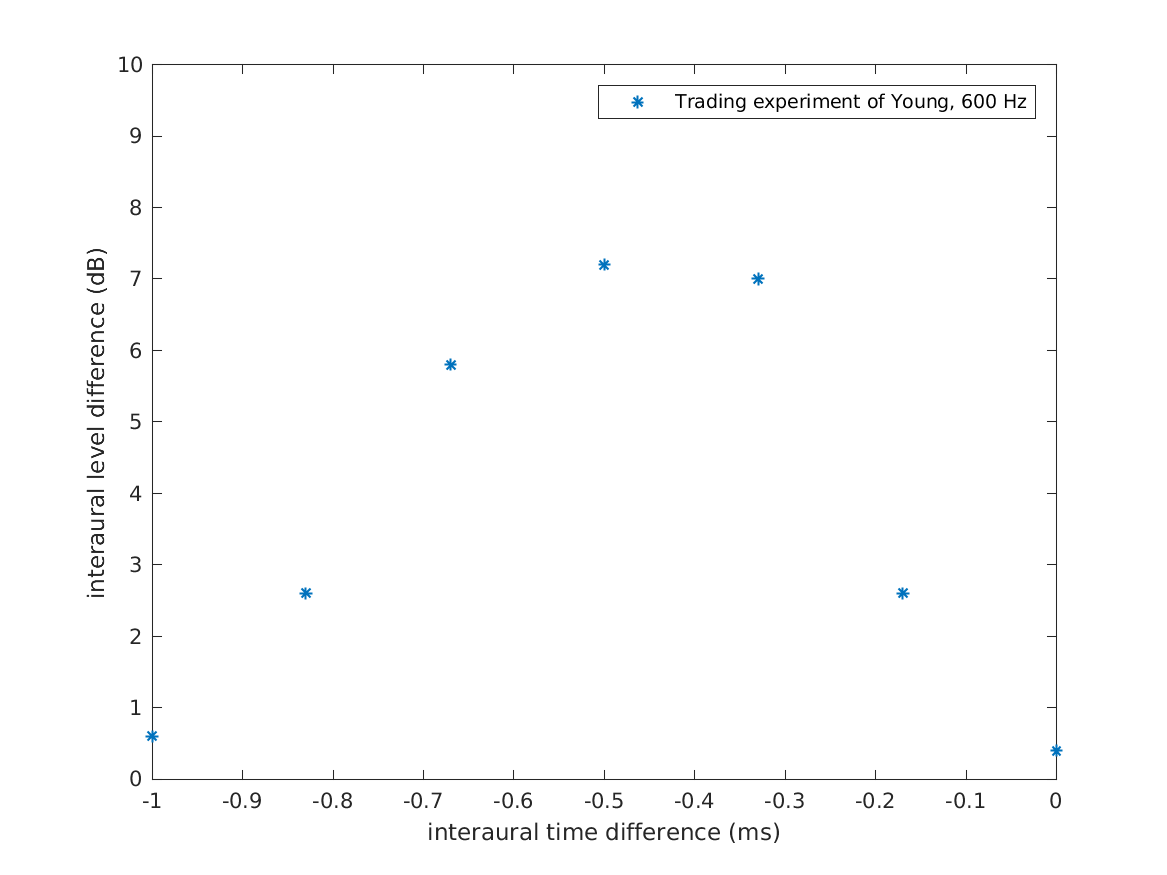
Figure 13 can be displayed by using
data_lindemann1986('fig13','plot');
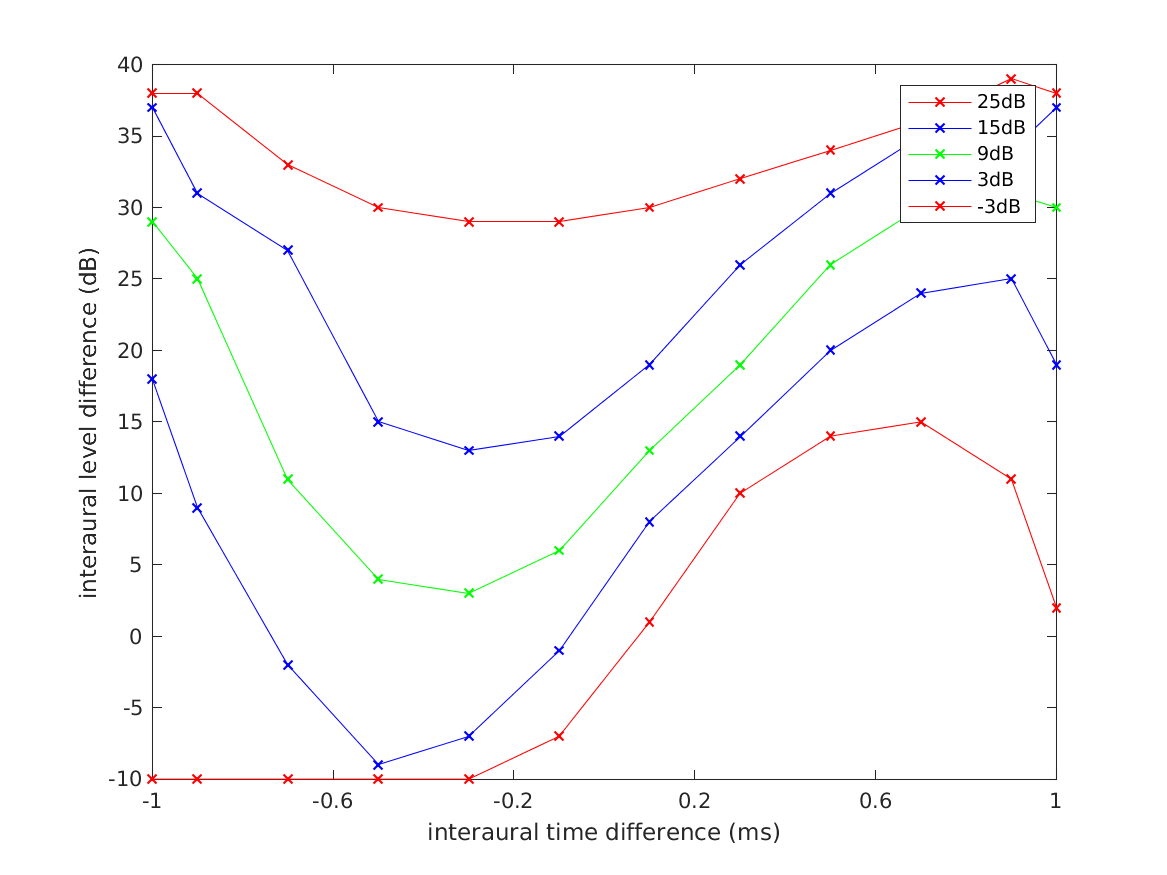
Figure 16 can be displayed using
data_lindemann1986('fig16','plot');
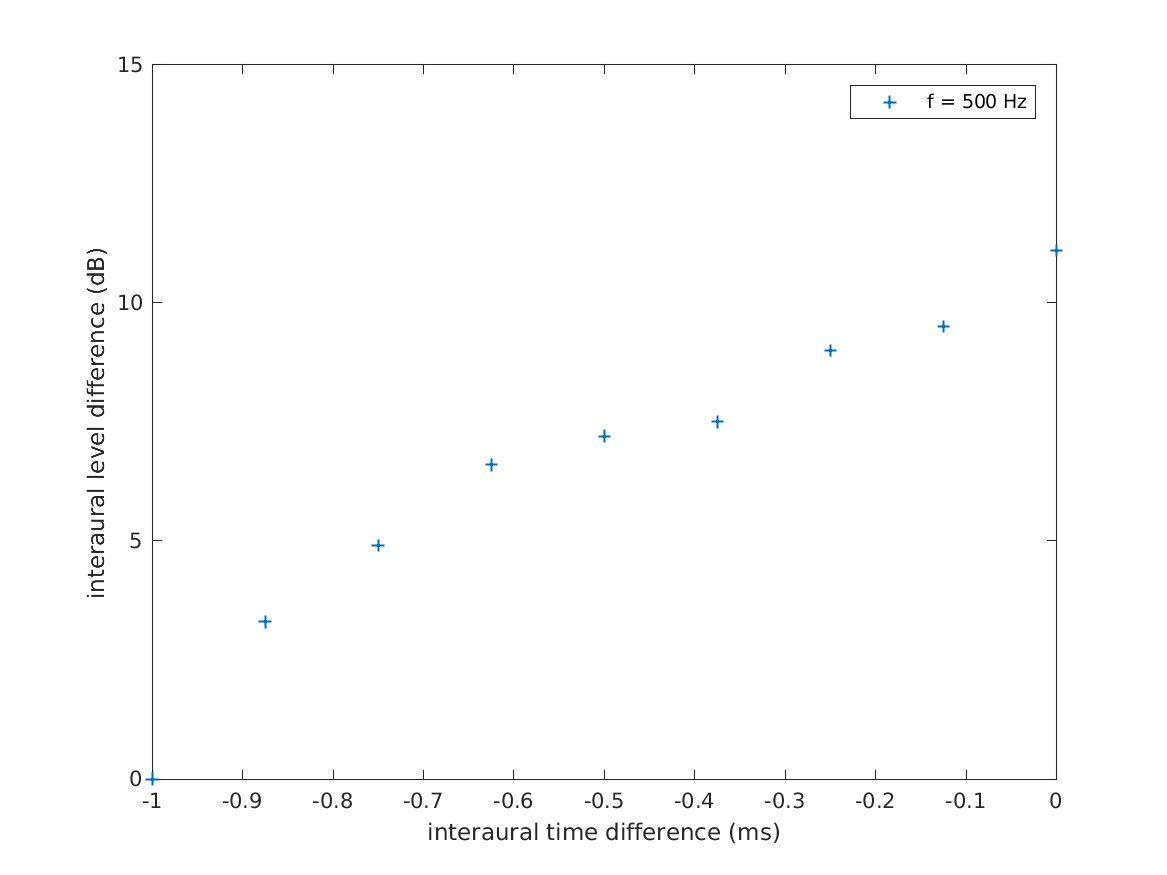
Figure 17 can be displayed using
data_lindemann1986('fig17','plot');
References:
W. Lindemann. Extension of a binaural cross-correlation model by contralateral inhibition. I. Simulation of lateralization for stationary signals. J. Acoust. Soc. Am., 80:1608--1622, 1986.


Build with Bootstrap