THE AUDITORY MODELING TOOLBOX
This documentation page applies to an outdated AMT version (1.1.0). Click here for the most recent page.
EXP_BAUMGARTNER2021 - - Simulations of Baumgartner and Majdak (2021)
Usage
data = exp_baumgartner2021(flag)
Description
exp_baumgartner2021(flag) reproduces figures of the study from Baumgartner and Majdak (2021).
The following flags can be specified
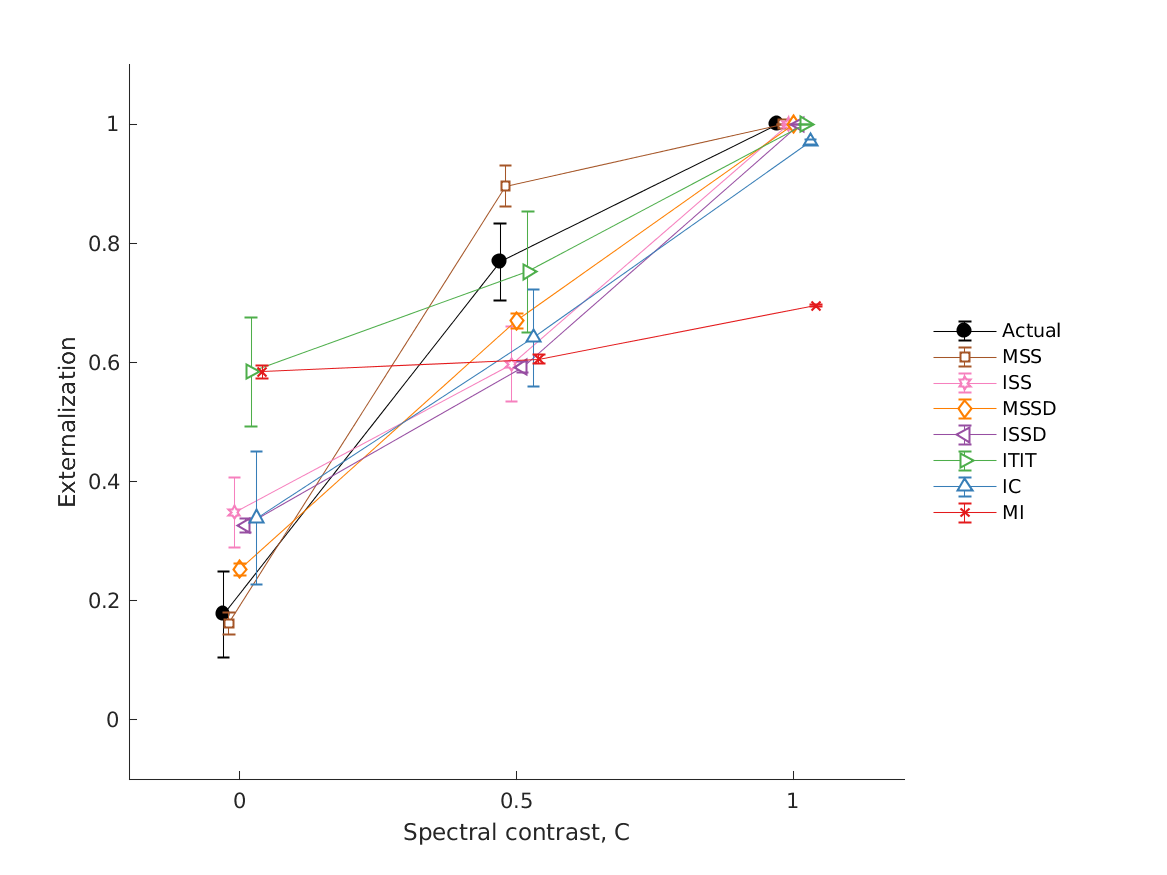
- fig2 Externalization ratings: actual data from psychoacoustic
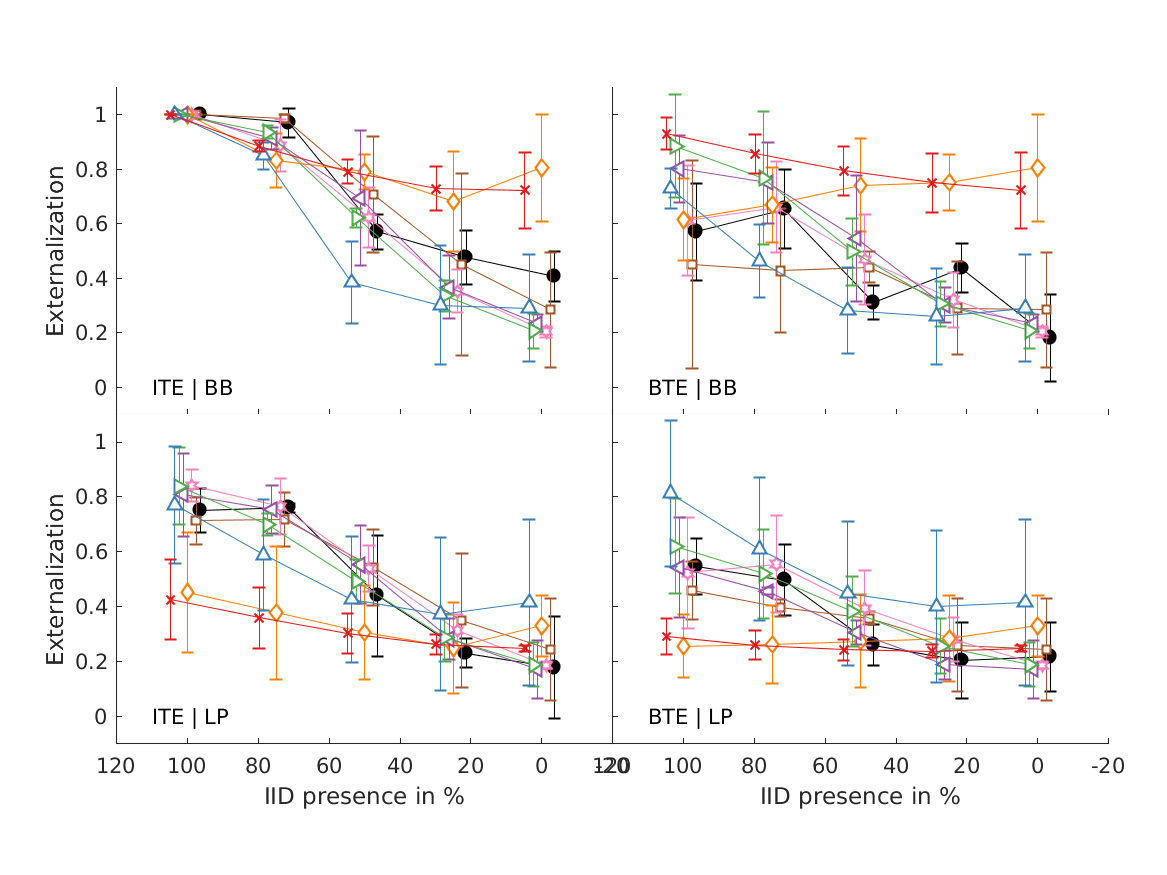
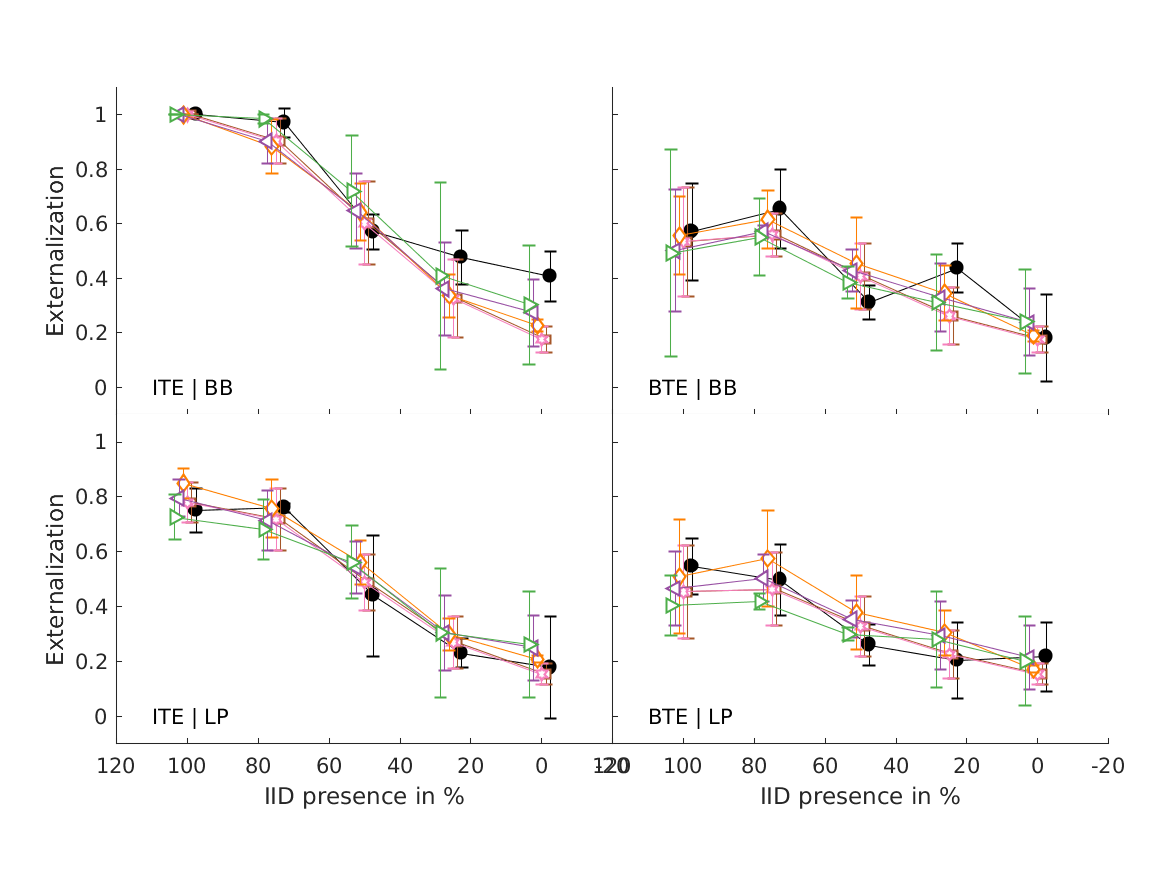
- experiments (closed circles) and simulations of the single-cue models (open symbols). Effects of low-frequency modifications tested by Hartmann and Wittenberg (1996). Exp. I: IID set to zero (bilateral average magnitude); actual data from their Fig.7, average from N=2. Exp. II: ipsilateral magnitudes flattened (IID compensated by contralateral magnitudes); actual data from their Fig.8, average from N=4. Simulated results for various cues, average from N=21. Exp.III: effect of spectral smoothing of low-frequency sounds presented from various azimuths (left: 0; right: 50); actual data represents direct-sound condition from Hassager et al. (2016), average from N=7. Simulated N=21. Exp.IV: effect of spectral smoothing in high frequencies as a function of spectral contrast (C=1: natural listener-specific spectral profile; C=0: flat spectra); actual data calculated from the paired-comparison data from Baumgartner et al. (2017), N=10 (actual and simulated). Exp.V: effects of stimulus bandwidth and microphone casing for various mixes between simulations based on listener-specific BRIRs (100%) and time-delay stereophony (0%); actual data from Boyd et al. (2012), N=3 (actual and simulated). ITE: in-the-ear casing; BTE: behind-the-ear casing; BB: broadband stimulus; LP: low-pass filtered at 6.5kHz; Error bars denote standard errors of the mean.
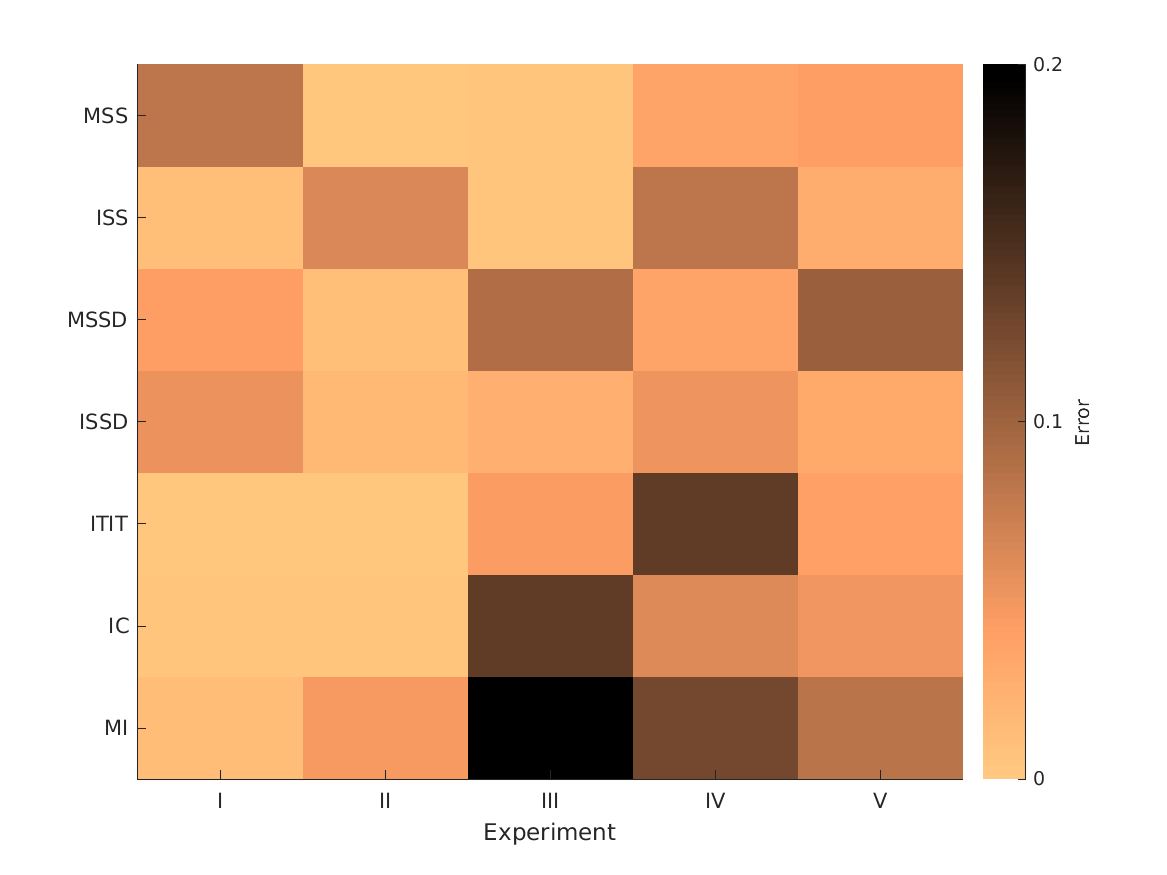
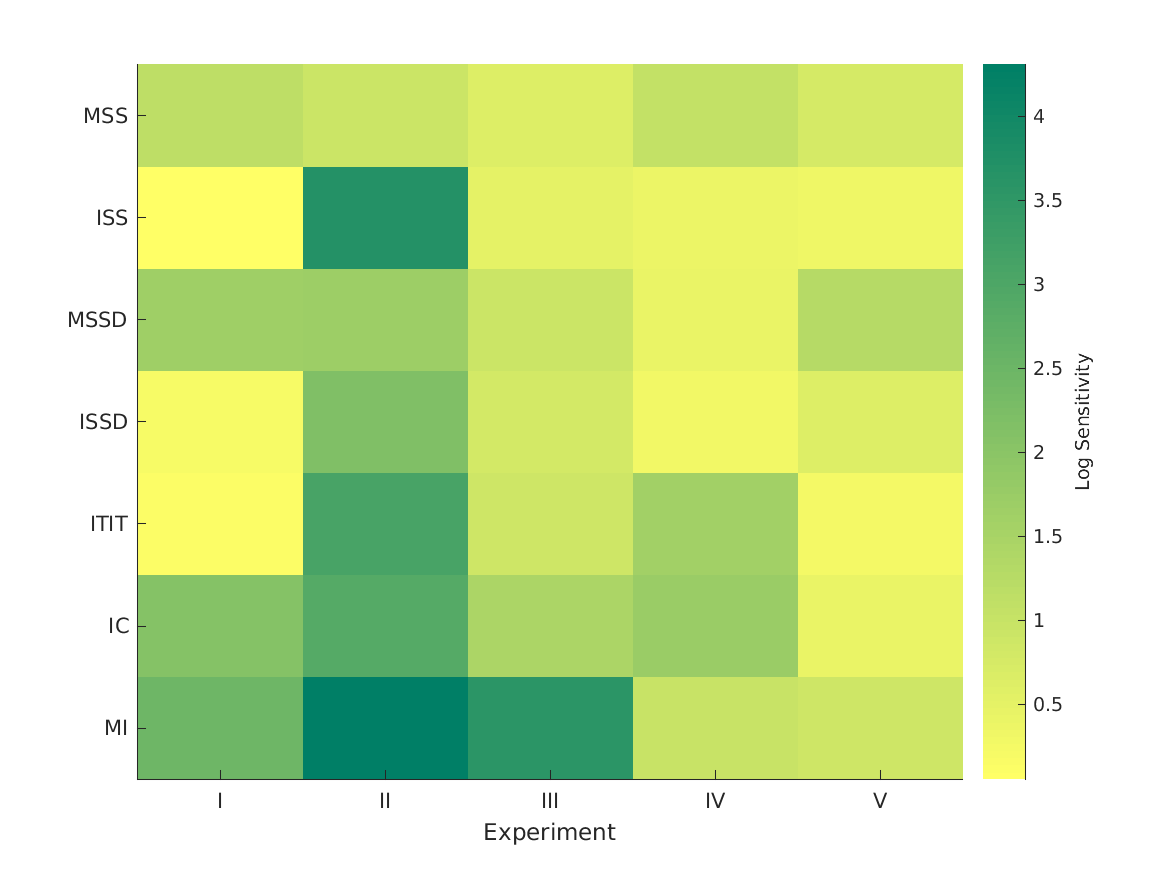
- fig3 Optimization and performance of single-cue models.
- Cue-specific sensitivities used as optimization parameters. Higher values denote steeper mapping functions. Simulation errors as the RMS difference between the actual and simulated externalization ratings. Per experiment, the smallest error indicates the most informative cue.
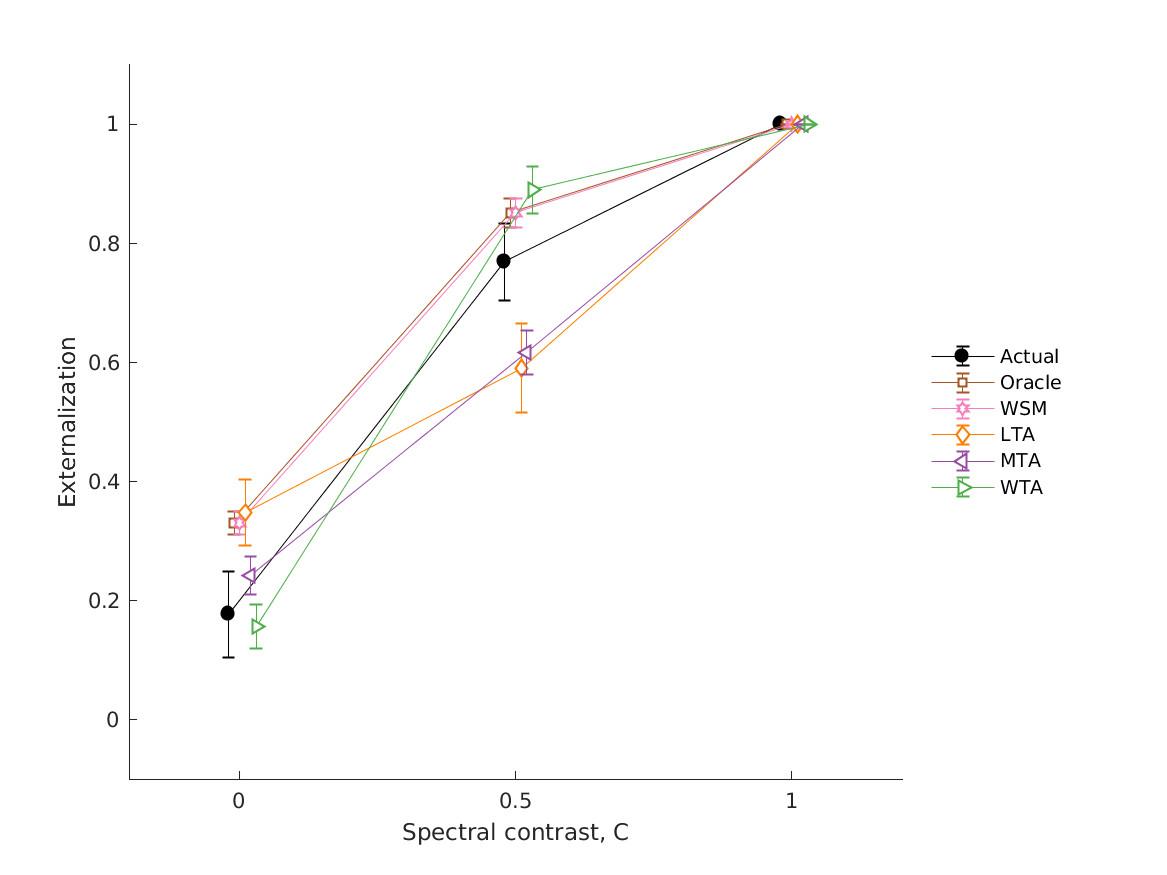
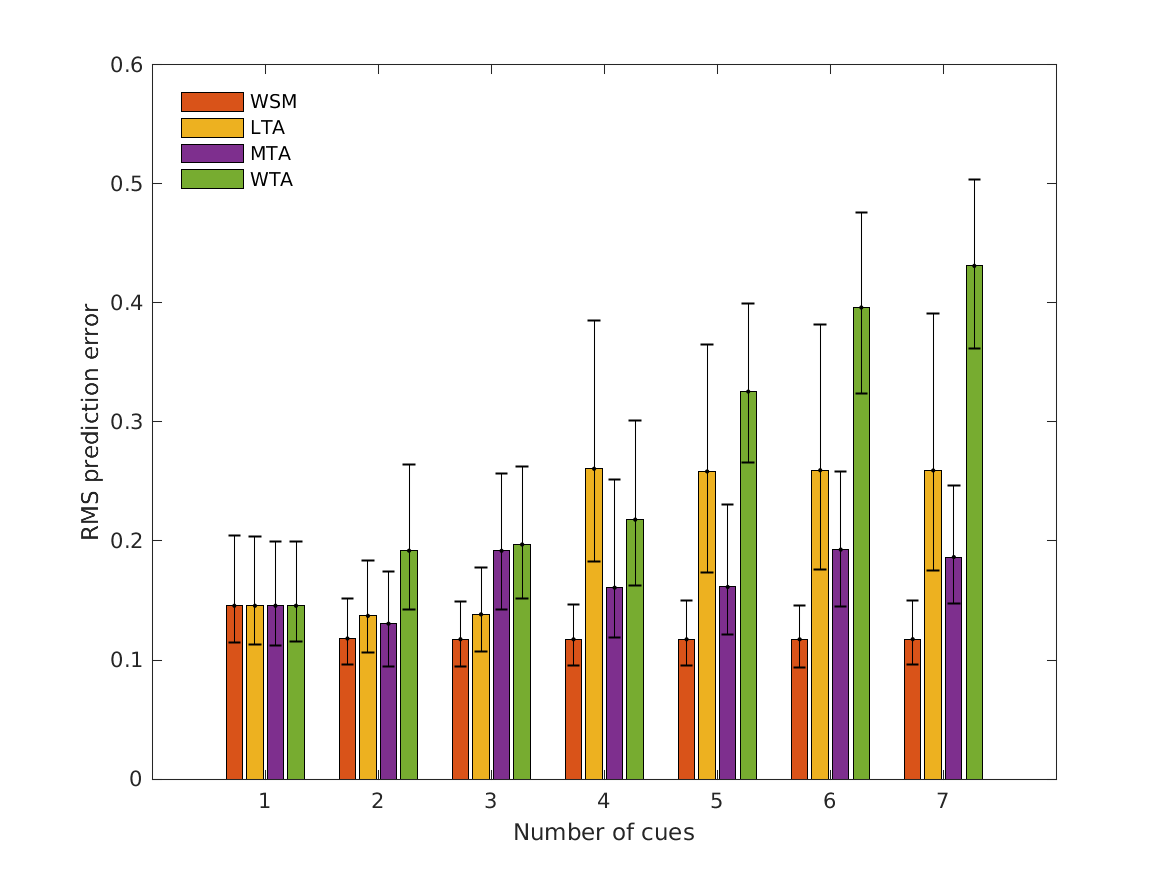
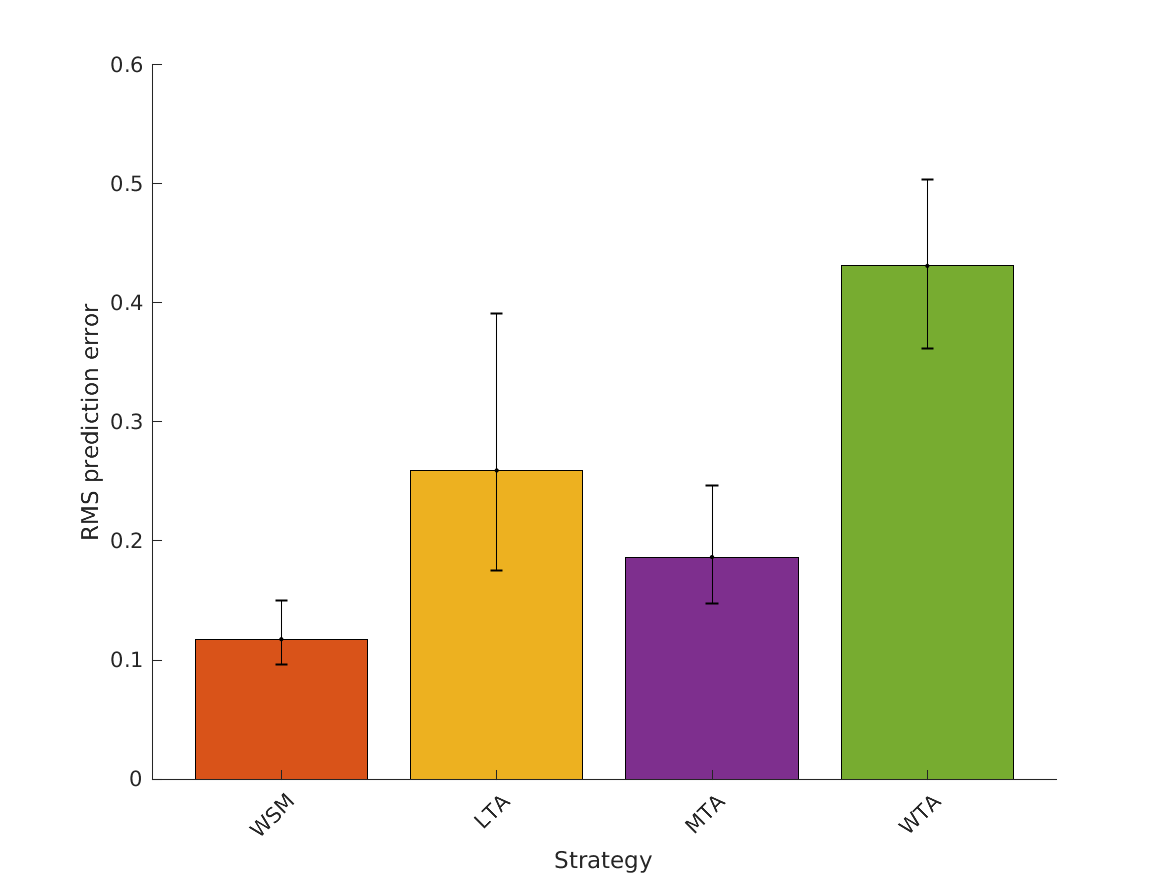
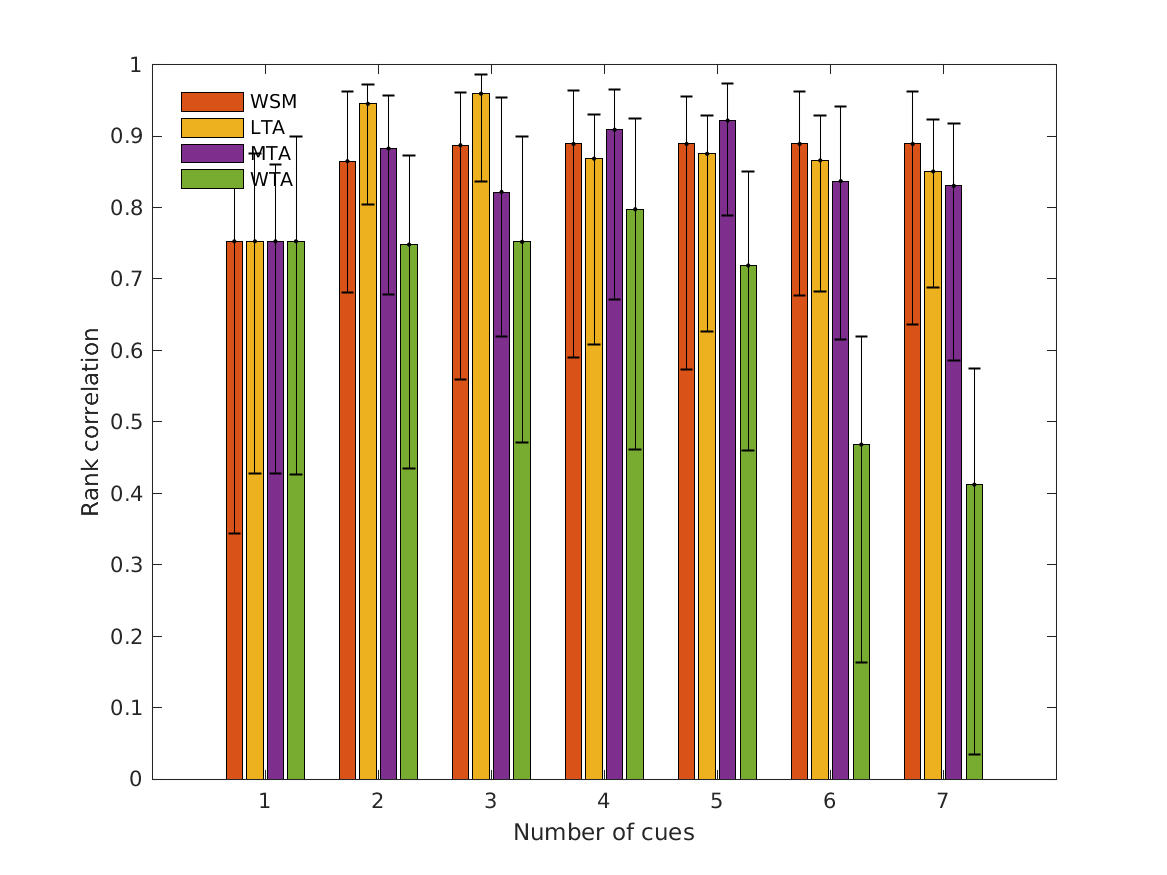
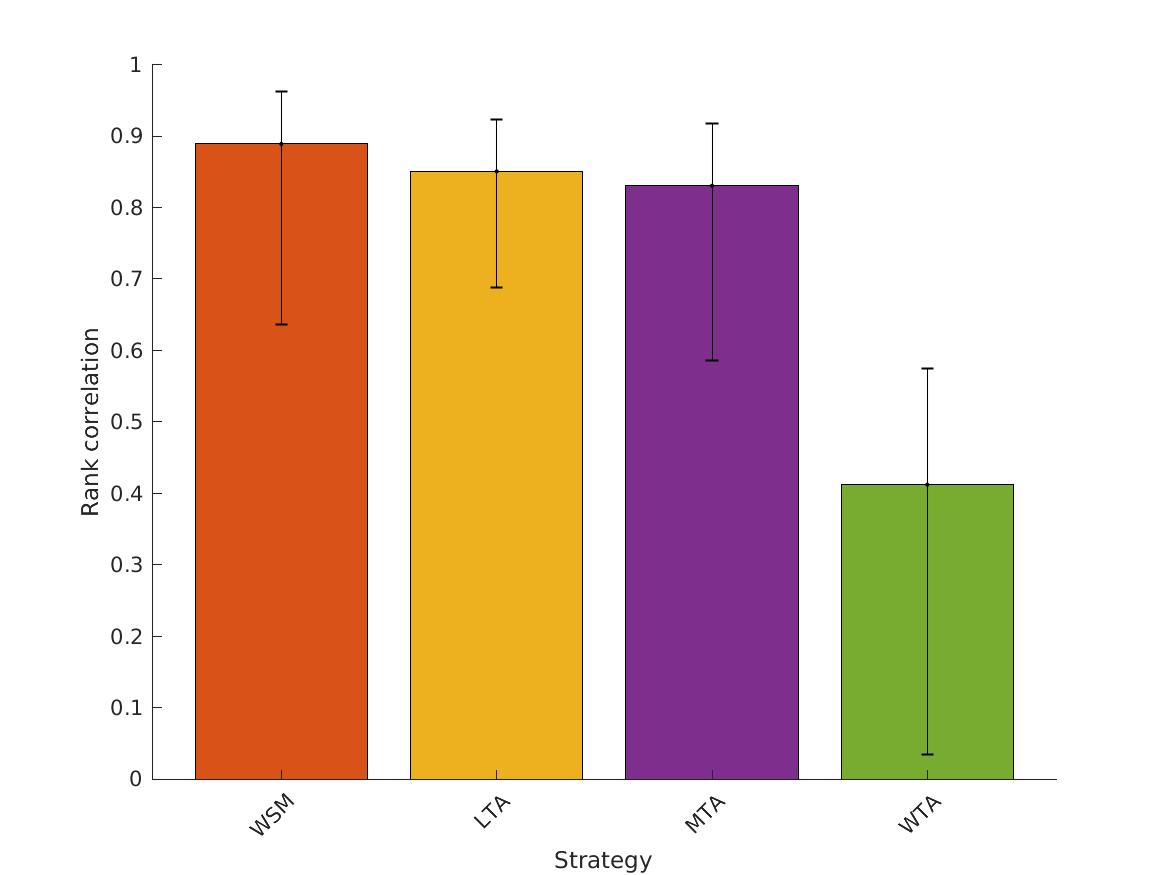
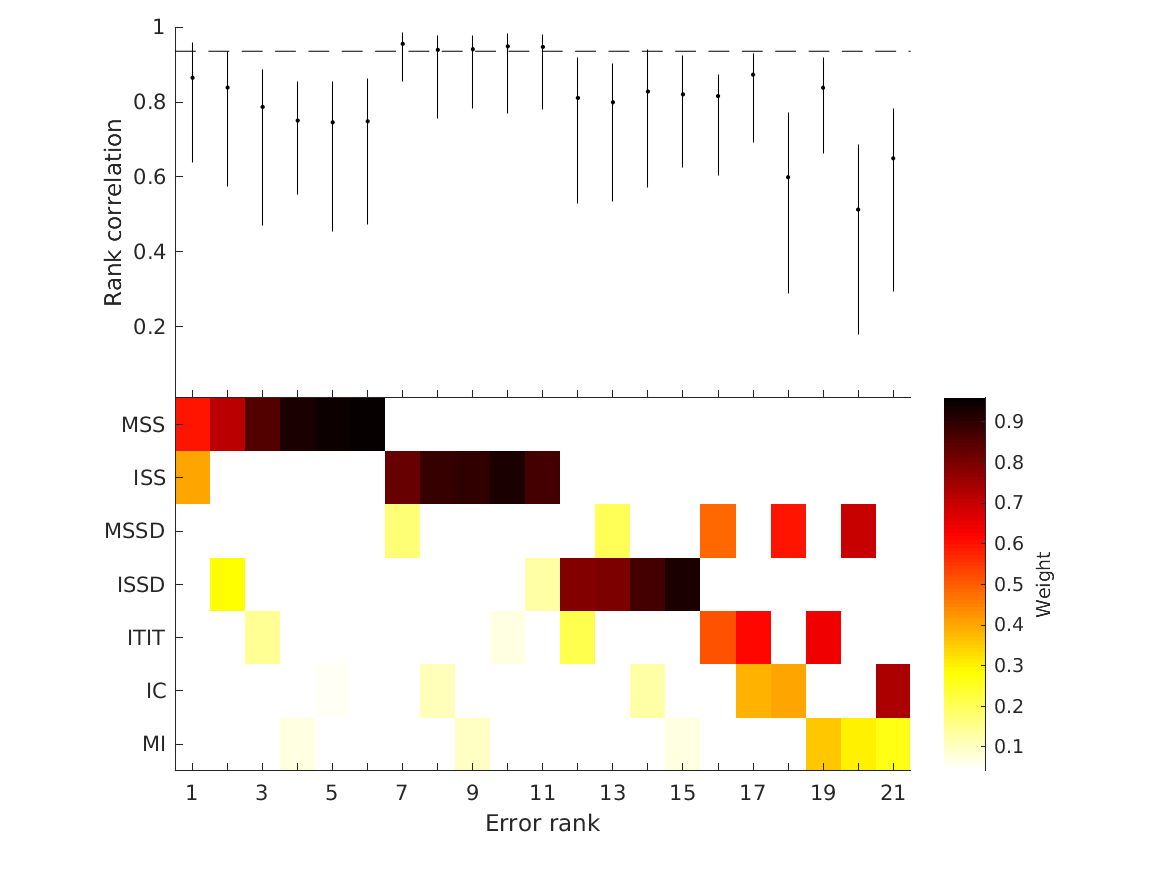
- fig4 Simulation errors for different decision strategies and cue
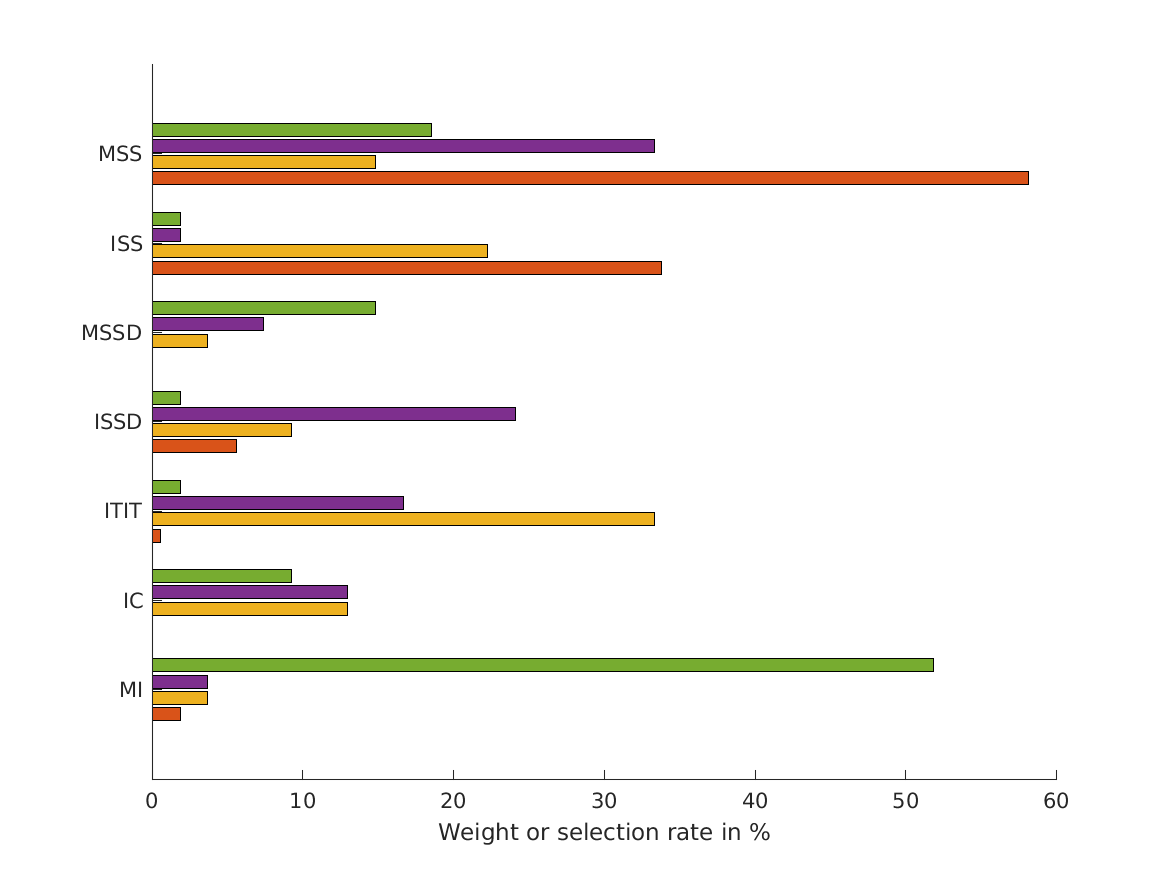
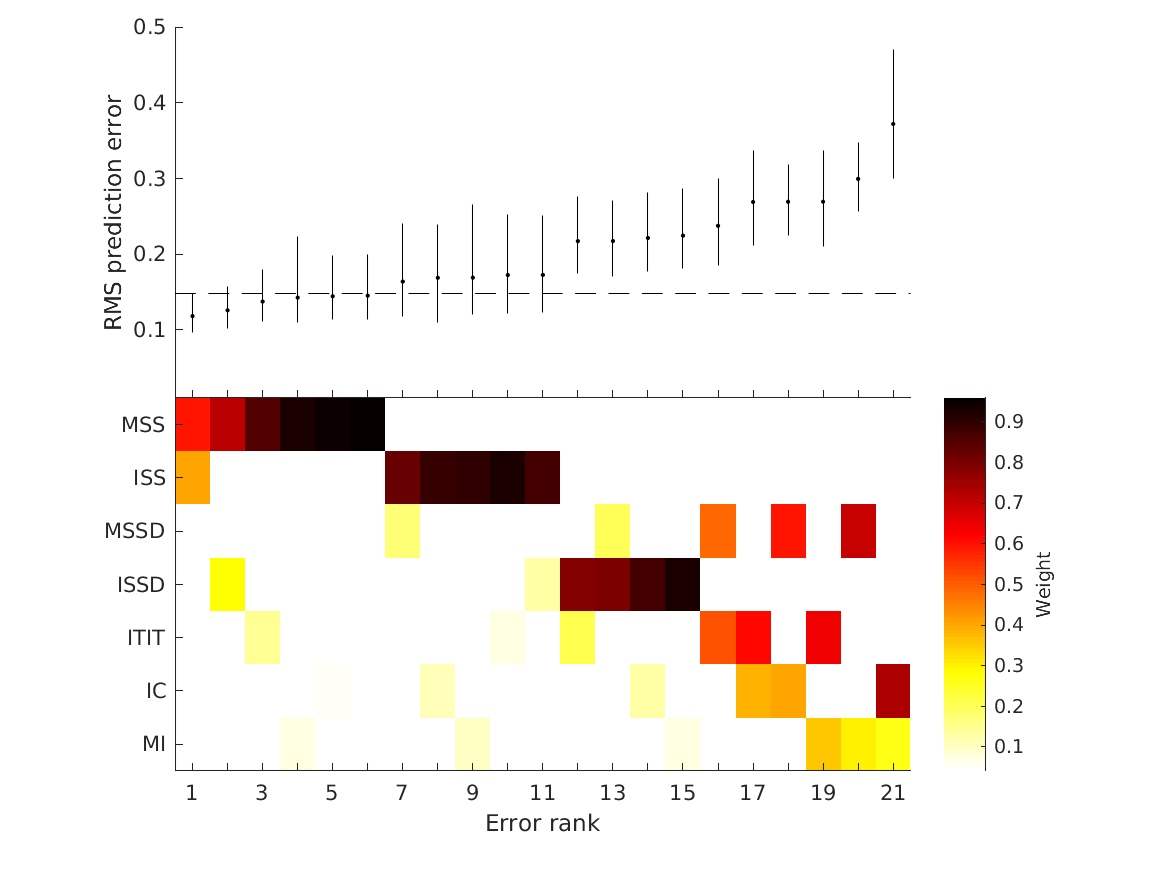
- combinations show that static combination (WSM) based on monaural and interaural spectral shape cues (MSS, ISS) performs best. RMS simulation errors for different strategies and pooled experimental data, N=54. Error bars denote 95% confidence intervals estimated via bootstrapping (1000 resamples). WSM: weighted-sum model; L/M/WTA: looser/median/winner takes all. Individual cue contributions. Cue abbreviations defined in Tab.1. Top: Simulation errors for pairwise combinations of considered cues. Dashed line shows the border of significant difference to the best pair (MSS and ISS). Bottom: Considered cue pairs with their respective weights (encoded by brightness).
- hartmann1996 models experiments from Hartmann & Wittenberg (1996; Fig.7-8)
- 1st panel: Synthesis of zero-ILD signals. Only the harmonics from 1 to nprime had zero interaural level difference; harmonics above nprime retained the amplitudes of the baseline synthesis. Externalization scores as a function of the boundary harmonic number nprime. Fundamental frequency of 125 Hz. 2nd panel: Synthesis of signals to test the ISLD hypothesis. Harmonics at and below the boundary retained only the interaural spectral level differences of the baseline synthesis. Higher harmonics retained left and right baseline harmonic levels. Externalization scores as a function of the boundary frequency.
- hassager2016 models experiments from Hassager et al. (2016; Fig.6).
- The mean of the seven listeners perceived sound source location (black) as a function of the bandwidth factor and the corresponding model predictions (colored). The model predictions have been shifted slightly to the right for a better visual interpretation. The error bars are one standard error of the mean.
- baumgartner2017 models experiments from Baumgartner et al. (2017).
- Effect of HRTF spectral contrast manipulations on sound externalization. Externalization scores were derived from paired comparisons via Bradley-Terry-Luce modeling.
- boyd2012 models experiments from Boyd et al. (2012; Fig.1, top).
- Average externalization ratings of 1 talker for NH participants against mix point as a function of microphone position (ITE/BTE) and frequency response (BB/LP). The reference condition (ref) is the same as ITE/BB. Error bars show SEM.
Requirements:
- SOFA API v0.4.3 or higher from http://sourceforge.net/projects/sofacoustics for Matlab (in e.g. thirdparty/SOFA)
- Data in hrtf/baumgartner2017
- Statistics Toolbox for Matlab (for some of the figures)
Examples:
To display indivdual predictions for all experiments use
exp_baumgartner2021('fig2');
This code produces the following output:
hartmann1996, Exp. 1
Showing modelling details for hartmann1996_exp1
S_cue Error Weight Description
_________ _________ ________ ______________________________________________________________________________________
MSS 0.073828 0.081818 0 'Monaural positive spectral gradients (c.f., Baumgartner et al., 2014)'
ISS 0.88369 0.011274 0 'Interaural spectral shape (c.f., Hassager et al., 2016)'
MSSD 0.021484 0.042295 0.012803 'Spectral SD of monaural positive spectral gradients (c.f., Baumgartner et al., 2014)'
ISSD 0.62119 0.052943 0 'Spectral SD of interaural spectral differences (c.f., Georganti et al., 2013)'
ITIT 0.79141 0.0035124 0.59117 'Interaural time-intensity trading (ITD vs. ILD)'
IC 0.0083008 0.0047487 0.32259 'Interaural coherence (c.f., Hassager et al., 2017)'
MI 0.0035156 0.012107 0.073434 'Monaural intensity difference (target - reference)'
Oracle NaN 0.0036647 NaN 'Weighted combination'
MSS ISS MSSD ISSD ITIT IC MI Oracle
_________ __________ ________ _________ __________ _________ __________ __________
Exp1_S_cue 0.073828 0.88369 0.021484 0.62119 0.79141 0.0083008 0.0035156 NaN
Exp1_Error 0.081818 0.011274 0.042295 0.052943 0.0035124 0.0047487 0.012107 0.0036647
Exp1_Weight 0 0 0.012803 0 0.59117 0.32259 0.073434 NaN
Exp2_S_cue 0.12051 0.00019531 0.019629 0.0069336 0.00078125 0.0012695 4.8828e-05 NaN
Exp2_Error 0.0019367 0.063476 0.010901 0.017217 0.0035481 0.0049122 0.046273 0.00029003
Exp2_Weight 0.019309 0 0.34659 0.032649 0.4388 0.16266 0 NaN
Exp3_S_cue 0.2293 0.33135 0.12402 0.15986 0.12969 0.035156 0.00026855 NaN
Exp3_Error 0.0053458 0.0047244 0.088551 0.025814 0.044811 0.13813 0.1971 0.0045675
Exp3_Weight 0.61553 0.0387 0 0.14921 0.19656 0 0 NaN
Exp4_S_cue 0.087988 0.4207 0.39395 0.50117 0.023828 0.018164 0.10439 NaN
Exp4_Error 0.036517 0.081148 0.036857 0.051565 0.13689 0.062149 0.12652 0.023824
Exp4_Weight 0.50583 0 0.19539 0 0 0.29878 0 NaN
Exp5_S_cue 0.18057 0.44687 0.054395 0.24404 0.54668 0.36709 0.13701 NaN
Exp5_Error 0.042443 0.028343 0.10339 0.032469 0.040747 0.050289 0.082399 0.014622
Exp5_Weight 0.24616 0.29003 0 0 0 0.31167 0.15214 NaN
W. Avg. S_cue 0.13308 0.41274 0.049147 0.13803 0.39968 0.006618 0.0067398 NaN
Mean Error 0.033612 0.037793 0.056398 0.036002 0.045902 0.052045 0.09288 0.0093937
Mean Weight 0.27737 0.065746 0.11096 0.036372 0.2453 0.21914 0.045114 NaN
Re-run to calculate WSM
Showing cue contributions for hartmann1996_exp1
MSS ISS MSSD ISSD ITIT IC MI Error_Oracle Error_WSM Error_LTA Error_MTA Error_WTA BIC_Oracle BIC_WSM BIC_LTA BIC_MTA BIC_WTA
_________ _______ ________ ____ _______ _______ _______ ____________ _________ _________ _________ _________ __________ _______ _______ _______ _______
MSS, ISS, MSSD, ISSD, ITIT, IC, MI 0 0 0.080388 0 0.1482 0.52158 0.24983 0.0051697 0.0051697 0.029587 0.03788 0.034267 -15.059 -15.059 -6.336 -5.1006 -5.6017
MSS, ISS, ISSD, ITIT, IC, MI 0.0060495 0 NaN 0 0.19353 0.43769 0.36273 0.0051008 0.0051008 0.027277 0.013738 0.028535 -16.735 -16.735 -8.3519 -11.781 -8.1264
MSS, ISS, ISSD, ITIT, IC 0.19658 0 NaN 0 0.1004 0.70301 NaN 0.0078322 0.0078322 0.047501 0.040286 0.052149 -16.2 -16.2 -7.1878 -8.0115 -6.721
MSS, ISS, ISSD, ITIT 0.46565 0 NaN 0 0.53435 NaN NaN 0.017369 0.017369 0.007816 0.010933 0.028289 -13.828 -13.828 -17.82 -16.142 -11.389
MSS, ISS, ISSD 0.53066 0.46934 NaN 0 NaN NaN NaN 0.030606 0.030606 0.0091715 0.029054 0.044256 -12.604 -12.604 -18.63 -12.865 -10.761
MSS, ISS 0.53067 0.46933 NaN NaN NaN NaN NaN 0.030606 0.030606 0.011251 0.019495 0.026936 -14.214 -14.214 -19.218 -16.469 -14.853
MSS 1 NaN NaN NaN NaN NaN NaN 0.091699 0.091699 0.081818 0.081818 0.081818 -10.337 -10.337 -10.907 -10.907 -10.907
hartmann1996, Exp. 2
Showing modelling details for hartmann1996_exp2
S_cue Error Weight Description
__________ __________ ________ ______________________________________________________________________________________
MSS 0.12051 0.0019367 0.019309 'Monaural positive spectral gradients (c.f., Baumgartner et al., 2014)'
ISS 0.00019531 0.063476 0 'Interaural spectral shape (c.f., Hassager et al., 2016)'
MSSD 0.019629 0.010901 0.34659 'Spectral SD of monaural positive spectral gradients (c.f., Baumgartner et al., 2014)'
ISSD 0.0069336 0.017217 0.032649 'Spectral SD of interaural spectral differences (c.f., Georganti et al., 2013)'
ITIT 0.00078125 0.0035481 0.4388 'Interaural time-intensity trading (ITD vs. ILD)'
IC 0.0012695 0.0049122 0.16266 'Interaural coherence (c.f., Hassager et al., 2017)'
MI 4.8828e-05 0.046273 0 'Monaural intensity difference (target - reference)'
Oracle NaN 0.00029003 NaN 'Weighted combination'
MSS ISS MSSD ISSD ITIT IC MI Oracle
_________ __________ ________ _________ __________ _________ __________ __________
Exp1_S_cue 0.073828 0.88369 0.021484 0.62119 0.79141 0.0083008 0.0035156 NaN
Exp1_Error 0.081818 0.011274 0.042295 0.052943 0.0035124 0.0047487 0.012107 0.0036647
Exp1_Weight 0 0 0.012803 0 0.59117 0.32259 0.073434 NaN
Exp2_S_cue 0.12051 0.00019531 0.019629 0.0069336 0.00078125 0.0012695 4.8828e-05 NaN
Exp2_Error 0.0019367 0.063476 0.010901 0.017217 0.0035481 0.0049122 0.046273 0.00029003
Exp2_Weight 0.019309 0 0.34659 0.032649 0.4388 0.16266 0 NaN
Exp3_S_cue 0.2293 0.33135 0.12402 0.15986 0.12969 0.035156 0.00026855 NaN
Exp3_Error 0.0053458 0.0047244 0.088551 0.025814 0.044811 0.13813 0.1971 0.0045675
Exp3_Weight 0.61553 0.0387 0 0.14921 0.19656 0 0 NaN
Exp4_S_cue 0.087988 0.4207 0.39395 0.50117 0.023828 0.018164 0.10439 NaN
Exp4_Error 0.036517 0.081148 0.036857 0.051565 0.13689 0.062149 0.12652 0.023824
Exp4_Weight 0.50583 0 0.19539 0 0 0.29878 0 NaN
Exp5_S_cue 0.18057 0.44687 0.054395 0.24404 0.54668 0.36709 0.13701 NaN
Exp5_Error 0.042443 0.028343 0.10339 0.032469 0.040747 0.050289 0.082399 0.014622
Exp5_Weight 0.24616 0.29003 0 0 0 0.31167 0.15214 NaN
W. Avg. S_cue 0.13308 0.41274 0.049147 0.13803 0.39968 0.006618 0.0067398 NaN
Mean Error 0.033612 0.037793 0.056398 0.036002 0.045902 0.052045 0.09288 0.0093937
Mean Weight 0.27737 0.065746 0.11096 0.036372 0.2453 0.21914 0.045114 NaN
Re-run to calculate WSM
Showing cue contributions for hartmann1996_exp2
MSS ISS MSSD ISSD ITIT IC MI Error_Oracle Error_WSM Error_LTA Error_MTA Error_WTA BIC_Oracle BIC_WSM BIC_LTA BIC_MTA BIC_WTA
_______ ___ _______ _______ ____ ________ ________ ____________ _________ __________ _________ _________ __________ _______ _______ _______ ________
MSS, ISS, MSSD, ISSD, ITIT, IC, MI 0.6551 0 0.22106 0 0 0.083722 0.040114 0.016778 0.016778 0.010236 0.034963 0.22382 -6.6467 -6.6467 -8.6235 -3.7098 3.7164
MSS, ISS, ISSD, ITIT, IC, MI 1 0 NaN 0 0 0 0 0.0026579 0.0026579 0.003992 0.064724 0.18434 -15.403 -15.403 -13.776 -2.6327 1.554
MSS, ISS, ISSD, ITIT, IC 0.80456 0 NaN 0.19544 0 0 NaN 0.013594 0.013594 0.00017209 0.0038498 0.25245 -10.261 -10.261 -27.738 -15.307 1.4254
MSS, ISS, ISSD, ITIT 1 0 NaN 0 0 NaN NaN 0.0026579 0.0026579 3.3568e-09 0.017171 0.20468 -18.176 -18.176 -72.504 -10.713 -0.80009
MSS, ISS, ISSD 1 0 NaN 0 NaN NaN NaN 0.0026579 0.0026579 0.0010269 0.044411 0.10298 -19.562 -19.562 -23.366 -8.2982 -4.9341
MSS, ISS 1 0 NaN NaN NaN NaN NaN 0.0026579 0.0026579 0.0018667 0.0084993 0.063476 -20.948 -20.948 -22.362 -16.298 -8.2558
MSS 1 NaN NaN NaN NaN NaN NaN 0.0026579 0.0026579 0.0019367 0.0019367 0.0019367 -22.335 -22.335 -23.601 -23.601 -23.601
hassager2016
Showing modelling details for hassager2016
S_cue Error Weight Description
__________ _________ _______ ______________________________________________________________________________________
MSS 0.2293 0.0053458 0.61553 'Monaural positive spectral gradients (c.f., Baumgartner et al., 2014)'
ISS 0.33135 0.0047244 0.0387 'Interaural spectral shape (c.f., Hassager et al., 2016)'
MSSD 0.12402 0.088551 0 'Spectral SD of monaural positive spectral gradients (c.f., Baumgartner et al., 2014)'
ISSD 0.15986 0.025814 0.14921 'Spectral SD of interaural spectral differences (c.f., Georganti et al., 2013)'
ITIT 0.12969 0.044811 0.19656 'Interaural time-intensity trading (ITD vs. ILD)'
IC 0.035156 0.13813 0 'Interaural coherence (c.f., Hassager et al., 2017)'
MI 0.00026855 0.1971 0 'Monaural intensity difference (target - reference)'
Oracle NaN 0.0045675 NaN 'Weighted combination'
MSS ISS MSSD ISSD ITIT IC MI Oracle
_________ __________ ________ _________ __________ _________ __________ __________
Exp1_S_cue 0.073828 0.88369 0.021484 0.62119 0.79141 0.0083008 0.0035156 NaN
Exp1_Error 0.081818 0.011274 0.042295 0.052943 0.0035124 0.0047487 0.012107 0.0036647
Exp1_Weight 0 0 0.012803 0 0.59117 0.32259 0.073434 NaN
Exp2_S_cue 0.12051 0.00019531 0.019629 0.0069336 0.00078125 0.0012695 4.8828e-05 NaN
Exp2_Error 0.0019367 0.063476 0.010901 0.017217 0.0035481 0.0049122 0.046273 0.00029003
Exp2_Weight 0.019309 0 0.34659 0.032649 0.4388 0.16266 0 NaN
Exp3_S_cue 0.2293 0.33135 0.12402 0.15986 0.12969 0.035156 0.00026855 NaN
Exp3_Error 0.0053458 0.0047244 0.088551 0.025814 0.044811 0.13813 0.1971 0.0045675
Exp3_Weight 0.61553 0.0387 0 0.14921 0.19656 0 0 NaN
Exp4_S_cue 0.087988 0.4207 0.39395 0.50117 0.023828 0.018164 0.10439 NaN
Exp4_Error 0.036517 0.081148 0.036857 0.051565 0.13689 0.062149 0.12652 0.023824
Exp4_Weight 0.50583 0 0.19539 0 0 0.29878 0 NaN
Exp5_S_cue 0.18057 0.44687 0.054395 0.24404 0.54668 0.36709 0.13701 NaN
Exp5_Error 0.042443 0.028343 0.10339 0.032469 0.040747 0.050289 0.082399 0.014622
Exp5_Weight 0.24616 0.29003 0 0 0 0.31167 0.15214 NaN
W. Avg. S_cue 0.13308 0.41274 0.049147 0.13803 0.39968 0.006618 0.0067398 NaN
Mean Error 0.033612 0.037793 0.056398 0.036002 0.045902 0.052045 0.09288 0.0093937
Mean Weight 0.27737 0.065746 0.11096 0.036372 0.2453 0.21914 0.045114 NaN
Re-run to calculate WSM
Showing cue contributions for hassager2016
MSS ISS MSSD ISSD ITIT IC MI Error_Oracle Error_WSM Error_LTA Error_MTA Error_WTA BIC_Oracle BIC_WSM BIC_LTA BIC_MTA BIC_WTA
_______ _______ ____ ________ _______ ___ ___ ____________ _________ _________ _________ _________ __________ _______ _______ _______ _______
MSS, ISS, MSSD, ISSD, ITIT, IC, MI 0.43641 0.38373 0 0.05808 0.12178 0 0 0.0035092 0.0035092 0.014033 0.019727 0.2163 -102.71 -102.71 -72.222 -64.73 -12.047
MSS, ISS, ISSD, ITIT, IC, MI 0.50071 0.25283 NaN 0.038252 0.2082 0 0 0.0039451 0.0039451 0.018788 0.01618 0.21281 -103.23 -103.23 -68.893 -72.182 -15.495
MSS, ISS, ISSD, ITIT, IC 0.26534 0.64544 NaN 0.089222 0 0 NaN 0.0029362 0.0029362 0.003581 0.0029892 0.13309 -112.82 -112.82 -108.45 -112.43 -28.912
MSS, ISS, ISSD, ITIT 0.2654 0.64527 NaN 0.08933 0 NaN NaN 0.0029362 0.0029362 0.0033264 0.0029445 0.051896 -115.91 -115.91 -113.17 -115.85 -52.723
MSS, ISS, ISSD 0.26542 0.64528 NaN 0.089293 NaN NaN NaN 0.0029362 0.0029362 0.0030982 0.0049041 0.0058874 -119 -119 -117.82 -107.72 -103.7
MSS, ISS 0.30677 0.69323 NaN NaN NaN NaN NaN 0.003161 0.003161 0.0017721 0.0030887 0.0046534 -120.47 -120.47 -133.2 -120.98 -111.96
MSS 1 NaN NaN NaN NaN NaN NaN 0.021879 0.021879 0.0053458 0.0053458 0.0053458 -80.998 -80.998 -112 -112 -112
baumgartner2017
Showing modelling details for baumgartner2017
S_cue Error Weight Description
________ ________ _______ ______________________________________________________________________________________
MSS 0.087988 0.036517 0.50583 'Monaural positive spectral gradients (c.f., Baumgartner et al., 2014)'
ISS 0.4207 0.081148 0 'Interaural spectral shape (c.f., Hassager et al., 2016)'
MSSD 0.39395 0.036857 0.19539 'Spectral SD of monaural positive spectral gradients (c.f., Baumgartner et al., 2014)'
ISSD 0.50117 0.051565 0 'Spectral SD of interaural spectral differences (c.f., Georganti et al., 2013)'
ITIT 0.023828 0.13689 0 'Interaural time-intensity trading (ITD vs. ILD)'
IC 0.018164 0.062149 0.29878 'Interaural coherence (c.f., Hassager et al., 2017)'
MI 0.10439 0.12652 0 'Monaural intensity difference (target - reference)'
Oracle NaN 0.023824 NaN 'Weighted combination'
MSS ISS MSSD ISSD ITIT IC MI Oracle
_________ __________ ________ _________ __________ _________ __________ __________
Exp1_S_cue 0.073828 0.88369 0.021484 0.62119 0.79141 0.0083008 0.0035156 NaN
Exp1_Error 0.081818 0.011274 0.042295 0.052943 0.0035124 0.0047487 0.012107 0.0036647
Exp1_Weight 0 0 0.012803 0 0.59117 0.32259 0.073434 NaN
Exp2_S_cue 0.12051 0.00019531 0.019629 0.0069336 0.00078125 0.0012695 4.8828e-05 NaN
Exp2_Error 0.0019367 0.063476 0.010901 0.017217 0.0035481 0.0049122 0.046273 0.00029003
Exp2_Weight 0.019309 0 0.34659 0.032649 0.4388 0.16266 0 NaN
Exp3_S_cue 0.2293 0.33135 0.12402 0.15986 0.12969 0.035156 0.00026855 NaN
Exp3_Error 0.0053458 0.0047244 0.088551 0.025814 0.044811 0.13813 0.1971 0.0045675
Exp3_Weight 0.61553 0.0387 0 0.14921 0.19656 0 0 NaN
Exp4_S_cue 0.087988 0.4207 0.39395 0.50117 0.023828 0.018164 0.10439 NaN
Exp4_Error 0.036517 0.081148 0.036857 0.051565 0.13689 0.062149 0.12652 0.023824
Exp4_Weight 0.50583 0 0.19539 0 0 0.29878 0 NaN
Exp5_S_cue 0.18057 0.44687 0.054395 0.24404 0.54668 0.36709 0.13701 NaN
Exp5_Error 0.042443 0.028343 0.10339 0.032469 0.040747 0.050289 0.082399 0.014622
Exp5_Weight 0.24616 0.29003 0 0 0 0.31167 0.15214 NaN
W. Avg. S_cue 0.13308 0.41274 0.049147 0.13803 0.39968 0.006618 0.0067398 NaN
Mean Error 0.033612 0.037793 0.056398 0.036002 0.045902 0.052045 0.09288 0.0093937
Mean Weight 0.27737 0.065746 0.11096 0.036372 0.2453 0.21914 0.045114 NaN
Re-run to calculate WSM
Showing cue contributions for baumgartner2017
MSS ISS MSSD ISSD ITIT IC MI Error_Oracle Error_WSM Error_LTA Error_MTA Error_WTA BIC_Oracle BIC_WSM BIC_LTA BIC_MTA BIC_WTA
_______ ________ ________ _______ ____ _______ ___ ____________ _________ _________ _________ _________ __________ _______ _______ _______ ________
MSS, ISS, MSSD, ISSD, ITIT, IC, MI 0.52452 0.28172 0.086544 0 0 0.10722 0 0.035458 0.035458 0.23958 0.039464 0.15924 -2.328 -2.328 3.4037 -2.0068 2.1782
MSS, ISS, ISSD, ITIT, IC, MI 0.65009 0.020944 NaN 0 0 0.32897 0 0.02563 0.02563 0.12867 0.035551 0.18553 -4.4003 -4.4003 0.44013 -3.4187 1.5381
MSS, ISS, ISSD, ITIT, IC 0.65318 0 NaN 0 0 0.34682 NaN 0.025209 0.025209 0.096862 0.018297 0.1465 -5.5486 -5.5486 -1.5103 -6.5101 -0.26922
MSS, ISS, ISSD, ITIT 0.77272 0 NaN 0.22728 0 NaN NaN 0.031348 0.031348 0.051862 0.030572 0.19647 -5.9934 -5.9934 -4.4831 -6.0686 -0.48736
MSS, ISS, ISSD 0.77131 0 NaN 0.22869 NaN NaN NaN 0.031347 0.031347 0.031438 0.042857 0.036134 -7.0921 -7.0921 -7.0834 -6.1538 -6.6657
MSS, ISS 0.76535 0.23465 NaN NaN NaN NaN NaN 0.042211 0.042211 0.077528 0.042494 0.03398 -7.298 -7.298 -5.4741 -7.2779 -7.9488
MSS 1 NaN NaN NaN NaN NaN NaN 0.045874 0.045874 0.036517 0.036517 0.036517 -8.147 -8.147 -8.8313 -8.8313 -8.8313
boyd2012
Showing modelling details for boyd2012
S_cue Error Weight Description
________ ________ _______ ______________________________________________________________________________________
MSS 0.18057 0.042443 0.24616 'Monaural positive spectral gradients (c.f., Baumgartner et al., 2014)'
ISS 0.44687 0.028343 0.29003 'Interaural spectral shape (c.f., Hassager et al., 2016)'
MSSD 0.054395 0.10339 0 'Spectral SD of monaural positive spectral gradients (c.f., Baumgartner et al., 2014)'
ISSD 0.24404 0.032469 0 'Spectral SD of interaural spectral differences (c.f., Georganti et al., 2013)'
ITIT 0.54668 0.040747 0 'Interaural time-intensity trading (ITD vs. ILD)'
IC 0.36709 0.050289 0.31167 'Interaural coherence (c.f., Hassager et al., 2017)'
MI 0.13701 0.082399 0.15214 'Monaural intensity difference (target - reference)'
Oracle NaN 0.014622 NaN 'Weighted combination'
MSS ISS MSSD ISSD ITIT IC MI Oracle
_________ __________ ________ _________ __________ _________ __________ __________
Exp1_S_cue 0.073828 0.88369 0.021484 0.62119 0.79141 0.0083008 0.0035156 NaN
Exp1_Error 0.081818 0.011274 0.042295 0.052943 0.0035124 0.0047487 0.012107 0.0036647
Exp1_Weight 0 0 0.012803 0 0.59117 0.32259 0.073434 NaN
Exp2_S_cue 0.12051 0.00019531 0.019629 0.0069336 0.00078125 0.0012695 4.8828e-05 NaN
Exp2_Error 0.0019367 0.063476 0.010901 0.017217 0.0035481 0.0049122 0.046273 0.00029003
Exp2_Weight 0.019309 0 0.34659 0.032649 0.4388 0.16266 0 NaN
Exp3_S_cue 0.2293 0.33135 0.12402 0.15986 0.12969 0.035156 0.00026855 NaN
Exp3_Error 0.0053458 0.0047244 0.088551 0.025814 0.044811 0.13813 0.1971 0.0045675
Exp3_Weight 0.61553 0.0387 0 0.14921 0.19656 0 0 NaN
Exp4_S_cue 0.087988 0.4207 0.39395 0.50117 0.023828 0.018164 0.10439 NaN
Exp4_Error 0.036517 0.081148 0.036857 0.051565 0.13689 0.062149 0.12652 0.023824
Exp4_Weight 0.50583 0 0.19539 0 0 0.29878 0 NaN
Exp5_S_cue 0.18057 0.44687 0.054395 0.24404 0.54668 0.36709 0.13701 NaN
Exp5_Error 0.042443 0.028343 0.10339 0.032469 0.040747 0.050289 0.082399 0.014622
Exp5_Weight 0.24616 0.29003 0 0 0 0.31167 0.15214 NaN
W. Avg. S_cue 0.13308 0.41274 0.049147 0.13803 0.39968 0.006618 0.0067398 NaN
Mean Error 0.033612 0.037793 0.056398 0.036002 0.045902 0.052045 0.09288 0.0093937
Mean Weight 0.27737 0.065746 0.11096 0.036372 0.2453 0.21914 0.045114 NaN
Re-run to calculate WSM
Showing cue contributions for boyd2012
MSS ISS MSSD ISSD ITIT IC MI Error_Oracle Error_WSM Error_LTA Error_MTA Error_WTA BIC_Oracle BIC_WSM BIC_LTA BIC_MTA BIC_WTA
_______ _______ ______ ____ ________ ___ ___ ____________ _________ _________ _________ _________ __________ _______ _______ _______ _______
MSS, ISS, MSSD, ISSD, ITIT, IC, MI 0.21257 0.6285 0.1101 0 0.048829 0 0 0.024687 0.024687 0.13362 0.029682 0.092207 -53.06 -53.06 -19.286 -49.374 -26.704
MSS, ISS, ISSD, ITIT, IC, MI 0.35473 0.43705 NaN 0 0.20823 0 0 0.027459 0.027459 0.09833 0.087682 0.090848 -53.927 -53.927 -28.414 -30.706 -29.997
MSS, ISS, ISSD, ITIT, IC 0.24 0.68939 NaN 0 0.070618 0 NaN 0.0265 0.0265 0.032461 0.02756 0.055326 -57.634 -57.634 -53.576 -56.849 -42.912
MSS, ISS, ISSD, ITIT 0.24023 0.689 NaN 0 0.070763 NaN NaN 0.0265 0.0265 0.059887 0.024031 0.044368 -60.629 -60.629 -44.323 -62.586 -50.322
MSS, ISS, ISSD 0.23669 0.76331 NaN 0 NaN NaN NaN 0.026618 0.026618 0.025463 0.025751 0.038386 -63.536 -63.536 -64.423 -64.198 -56.214
MSS, ISS 0.2367 0.7633 NaN NaN NaN NaN NaN 0.026618 0.026618 0.026561 0.026807 0.038242 -66.532 -66.532 -66.574 -66.391 -59.285
MSS 1 NaN NaN NaN NaN NaN NaN 0.052145 0.052145 0.042443 0.042443 0.042443 -56.079 -56.079 -60.196 -60.196 -60.196
To display summary results for all experiments use
exp_baumgartner2021('fig3');
This code produces the following output:
MSS          ISS          MSSD        ISSD          ITIT          IC            MI          Oracle
                     _________    __________    ________    _________    __________    _________    __________    __________

    Exp1_S_cue        0.073828       0.88369    0.021484      0.62119       0.79141    0.0083008     0.0035156           NaN
    Exp1_Error        0.081818      0.011274    0.042295     0.052943     0.0035124    0.0047487      0.012107     0.0036647
    Exp1_Weight              0             0    0.012803            0       0.59117      0.32259      0.073434           NaN
    Exp2_S_cue         0.12051    0.00019531    0.019629    0.0069336    0.00078125    0.0012695    4.8828e-05           NaN
    Exp2_Error       0.0019367      0.063476    0.010901     0.017217     0.0035481    0.0049122      0.046273    0.00029003
    Exp2_Weight       0.019309             0     0.34659     0.032649        0.4388      0.16266             0           NaN
    Exp3_S_cue          0.2293       0.33135     0.12402      0.15986       0.12969     0.035156    0.00026855           NaN
    Exp3_Error       0.0053458     0.0047244    0.088551     0.025814      0.044811      0.13813        0.1971     0.0045675
    Exp3_Weight        0.61553        0.0387           0      0.14921       0.19656            0             0           NaN
    Exp4_S_cue        0.087988        0.4207     0.39395      0.50117      0.023828     0.018164       0.10439           NaN
    Exp4_Error        0.036517      0.081148    0.036857     0.051565       0.13689     0.062149       0.12652      0.023824
    Exp4_Weight        0.50583             0     0.19539            0             0      0.29878             0           NaN
    Exp5_S_cue         0.18057       0.44687    0.054395      0.24404       0.54668      0.36709       0.13701           NaN
    Exp5_Error        0.042443      0.028343     0.10339     0.032469      0.040747     0.050289      0.082399      0.014622
    Exp5_Weight        0.24616       0.29003           0            0             0      0.31167       0.15214           NaN
    W. Avg. S_cue      0.13308       0.41274    0.049147      0.13803       0.39968     0.006618     0.0067398           NaN
    Mean Error        0.033612      0.037793    0.056398     0.036002      0.045902     0.052045       0.09288     0.0093937
    Mean Weight        0.27737      0.065746     0.11096     0.036372        0.2453      0.21914      0.045114           NaN
To display results for different decision strategies use
exp_baumgartner2021('fig4');
This code produces the following output:
Prediciton errors for tested decisions:
RMSE_WSM RMSE_LTA RMSE_MTA RMSE_WTA RC_WSM RC_LTA RC_MTA RC_WTA
________ ________ ________ ________ _______ _______ _______ _______
MSS, ISS, MSSD, ISSD, ITIT, IC, MI 0.11753 0.25924 0.18648 0.43099 0.88895 0.85049 0.83032 0.41214
MSS, ISS, ISSD, ITIT, IC, MI 0.11744 0.25938 0.19273 0.39602 0.88895 0.86592 0.83704 0.46829
MSS, ISS, ISSD, ITIT, IC 0.11746 0.2584 0.16137 0.32548 0.88895 0.87518 0.92162 0.71882
MSS, ISS, ISSD, ITIT 0.11746 0.26063 0.16076 0.21793 0.88895 0.86842 0.90879 0.79757
MSS, ISS, ISSD 0.11748 0.13835 0.19177 0.19704 0.88711 0.95925 0.82167 0.752
MSS, ISS 0.11809 0.1371 0.13054 0.19185 0.86478 0.94514 0.88249 0.74811
MSS 0.1456 0.1456 0.1456 0.1456 0.75263 0.75263 0.75263 0.75263
WSM weights/percentages
MSS ISS MSSD ISSD ITIT IC MI RMSE RC
_______ _______ ____ ________ _________ ___ _________ _______ _______
MSS, ISS, MSSD, ISSD, ITIT, IC, MI 0.5816 0.33791 0 0.055988 0.0053909 0 0.019103 0.11753 0.88895
MSS, ISS, ISSD, ITIT, IC, MI 0.59139 0.33241 NaN 0.062229 0.0073198 0 0.0066538 0.11744 0.88895
MSS, ISS, ISSD, ITIT, IC 0.59457 0.32888 NaN 0.069538 0.0070146 0 NaN 0.11746 0.88895
MSS, ISS, ISSD, ITIT 0.59439 0.32892 NaN 0.069645 0.0070426 NaN NaN 0.11746 0.88895
MSS, ISS, ISSD 0.59553 0.33176 NaN 0.072712 NaN NaN NaN 0.11748 0.88711
MSS, ISS 0.59938 0.40062 NaN NaN NaN NaN NaN 0.11809 0.86478
MSS 1 NaN NaN NaN NaN NaN NaN 0.1456 0.75263
WSM mapping sensitivity
MSS ISS MSSD ISSD ITIT IC MI
_______ _______ ________ _______ _______ _______ _______
MSS, ISS, MSSD, ISSD, ITIT, IC, MI 0.20029 0.51084 0.080273 0.24854 0.49307 0.33066 0.12891
MSS, ISS, ISSD, ITIT, IC, MI 0.20029 0.51084 NaN 0.24854 0.49307 0.33066 0.12891
MSS, ISS, ISSD, ITIT, IC 0.20029 0.51084 NaN 0.24854 0.49307 0.33066 NaN
MSS, ISS, ISSD, ITIT 0.20029 0.51084 NaN 0.24854 0.49307 NaN NaN
MSS, ISS, ISSD 0.20029 0.51084 NaN 0.24854 NaN NaN NaN
MSS, ISS 0.20029 0.51084 NaN NaN NaN NaN NaN
MSS 0.20029 NaN NaN NaN NaN NaN NaN
LTA weights/percentages
MSS ISS MSSD ISSD ITIT IC MI RMSE RC
______ ______ ______ ______ ______ ______ ______ _______ _______
MSS, ISS, MSSD, ISSD, ITIT, IC, MI 14.815 22.222 3.7037 9.2593 33.333 12.963 3.7037 0.25924 0.85049
MSS, ISS, ISSD, ITIT, IC, MI 12.963 22.222 NaN 9.2593 38.889 12.963 3.7037 0.25938 0.86592
MSS, ISS, ISSD, ITIT, IC 12.963 31.481 NaN 9.2593 31.481 14.815 NaN 0.2584 0.87518
MSS, ISS, ISSD, ITIT 12.963 25.926 NaN 14.815 46.296 NaN NaN 0.26063 0.86842
MSS, ISS, ISSD 12.963 62.963 NaN 24.074 NaN NaN NaN 0.13835 0.95925
MSS, ISS 24.074 75.926 NaN NaN NaN NaN NaN 0.1371 0.94514
MSS 100 NaN NaN NaN NaN NaN NaN 0.1456 0.75263
LTA mapping sensitivity
MSS ISS MSSD ISSD ITIT IC MI
_______ _______ ______ _______ _______ _______ _______
MSS, ISS, MSSD, ISSD, ITIT, IC, MI 0.52415 0.52027 1.2398 0.7091 0.42722 0.701 0.55164
MSS, ISS, ISSD, ITIT, IC, MI 0.65955 0.50175 NaN 0.63696 0.53876 0.56382 0.48832
MSS, ISS, ISSD, ITIT, IC 0.66421 0.645 NaN 0.49837 0.48206 0.59694 NaN
MSS, ISS, ISSD, ITIT 0.619 0.47043 NaN 0.58458 0.52859 NaN NaN
MSS, ISS, ISSD 0.529 0.46983 NaN 0.48831 NaN NaN NaN
MSS, ISS 0.53225 0.45265 NaN NaN NaN NaN NaN
MSS 0.20029 NaN NaN NaN NaN NaN NaN
MTA weights/percentages
MSS ISS MSSD ISSD ITIT IC MI RMSE RC
______ ______ ______ ______ ______ ______ ______ _______ _______
MSS, ISS, MSSD, ISSD, ITIT, IC, MI 33.333 1.8519 7.4074 24.074 16.667 12.963 3.7037 0.18648 0.83032
MSS, ISS, ISSD, ITIT, IC, MI 31.481 20.37 NaN 33.333 7.4074 5.5556 1.8519 0.19273 0.83704
MSS, ISS, ISSD, ITIT, IC 25.926 16.667 NaN 24.074 20.37 12.963 NaN 0.16137 0.92162
MSS, ISS, ISSD, ITIT 37.037 35.185 NaN 22.222 5.5556 NaN NaN 0.16076 0.90879
MSS, ISS, ISSD 38.889 14.815 NaN 46.296 NaN NaN NaN 0.19177 0.82167
MSS, ISS 79.63 20.37 NaN NaN NaN NaN NaN 0.13054 0.88249
MSS 100 NaN NaN NaN NaN NaN NaN 0.1456 0.75263
MTA mapping sensitivity
MSS ISS MSSD ISSD ITIT IC MI
_______ _______ ______ _______ ________ _______ _______
MSS, ISS, MSSD, ISSD, ITIT, IC, MI 0.31861 0.30829 0.1204 0.17006 0.014735 0.2665 0.15971
MSS, ISS, ISSD, ITIT, IC, MI 0.25147 0.20099 NaN 0.25667 0.24117 0.23628 0.20293
MSS, ISS, ISSD, ITIT, IC 0.24786 0.11211 NaN 0.36074 0.75978 0.24627 NaN
MSS, ISS, ISSD, ITIT 0.11195 0.36695 NaN 0.66352 0.23544 NaN NaN
MSS, ISS, ISSD 0.28021 0.27909 NaN 0.28688 NaN NaN NaN
MSS, ISS 0.32468 0.27857 NaN NaN NaN NaN NaN
MSS 0.20029 NaN NaN NaN NaN NaN NaN
WTA weights/percentages
MSS ISS MSSD ISSD ITIT IC MI RMSE RC
______ ______ ______ ______ ______ ______ ______ _______ _______
MSS, ISS, MSSD, ISSD, ITIT, IC, MI 18.519 1.8519 14.815 1.8519 1.8519 9.2593 51.852 0.43099 0.41214
MSS, ISS, ISSD, ITIT, IC, MI 22.222 0 NaN 1.8519 3.7037 1.8519 70.37 0.39602 0.46829
MSS, ISS, ISSD, ITIT, IC 37.037 11.111 NaN 11.111 7.4074 33.333 NaN 0.32548 0.71882
MSS, ISS, ISSD, ITIT 53.704 14.815 NaN 16.667 14.815 NaN NaN 0.21793 0.79757
MSS, ISS, ISSD 66.667 9.2593 NaN 24.074 NaN NaN NaN 0.19704 0.752
MSS, ISS 88.889 11.111 NaN NaN NaN NaN NaN 0.19185 0.74811
MSS 100 NaN NaN NaN NaN NaN NaN 0.1456 0.75263
WTA mapping sensitivity
MSS ISS MSSD ISSD ITIT IC MI
________ _________ __________ _______ ________ _______ _________
MSS, ISS, MSSD, ISSD, ITIT, IC, MI 0.18115 0.12708 0.00010554 0.12075 0.032915 0.44682 0.15632
MSS, ISS, ISSD, ITIT, IC, MI 0.086929 0.0098455 NaN 0.27546 0.2765 0.12867 0.0070348
MSS, ISS, ISSD, ITIT, IC 0.013149 0.021515 NaN 0.23154 0.011956 0.53341 NaN
MSS, ISS, ISSD, ITIT 0.14314 0.16601 NaN 0.17594 0.038588 NaN NaN
MSS, ISS, ISSD 0.16625 0.15317 NaN 0.17221 NaN NaN NaN
MSS, ISS 0.22118 0.18547 NaN NaN NaN NaN NaN
MSS 0.20029 NaN NaN NaN NaN NaN NaN
Contributions and Prediction errors:
MSS ISS MSSD ISSD ITIT IC MI WSM_RMSE RMSE_CIlow RMSE_CIhigh RC RC_CIlow RC_CIhigh
_______ _______ ________ _______ ________ ________ ________ ________ __________ ___________ _______ ________ _________
0.59938 0.40062 NaN NaN NaN NaN NaN 0.11809 0.095931 0.148 0.86478 0.63854 0.95942
0.71892 NaN NaN 0.28108 NaN NaN NaN 0.12576 0.10172 0.15657 0.83843 0.57385 0.93549
0.85523 NaN NaN NaN 0.14477 NaN NaN 0.13731 0.11051 0.17953 0.7868 0.46955 0.88708
0.92842 NaN NaN NaN NaN NaN 0.071582 0.14262 0.11024 0.22371 0.7504 0.55194 0.85547
0.94641 NaN NaN NaN NaN 0.053586 NaN 0.14426 0.1132 0.19818 0.74569 0.4551 0.8543
0.95871 NaN 0.041292 NaN NaN NaN NaN 0.14507 0.11371 0.19892 0.74844 0.47308 0.86354
NaN 0.82733 0.17267 NaN NaN NaN NaN 0.16374 0.11742 0.24013 0.95525 0.85432 0.98604
NaN 0.89015 NaN NaN NaN 0.10985 NaN 0.16868 0.10935 0.23963 0.93912 0.75659 0.97646
NaN 0.90102 NaN NaN NaN NaN 0.098984 0.16893 0.12065 0.26496 0.94077 0.78268 0.97695
NaN 0.92343 NaN NaN 0.076571 NaN NaN 0.17232 0.12141 0.25191 0.94876 0.76957 0.98323
NaN 0.8758 NaN 0.1242 NaN NaN NaN 0.1725 0.12252 0.25112 0.94708 0.77888 0.98121
NaN NaN NaN 0.78826 0.21174 NaN NaN 0.21719 0.17419 0.27603 0.81082 0.52927 0.9191
NaN NaN 0.20616 0.79384 NaN NaN NaN 0.21723 0.16999 0.27087 0.79928 0.53328 0.90173
NaN NaN NaN 0.87082 NaN 0.12918 NaN 0.22133 0.17768 0.28127 0.82783 0.57306 0.94132
NaN NaN NaN 0.92908 NaN NaN 0.070921 0.22443 0.18078 0.28698 0.82031 0.62603 0.92533
NaN NaN 0.49042 NaN 0.50958 NaN NaN 0.23738 0.1856 0.29973 0.81579 0.60312 0.87345
NaN NaN NaN NaN 0.61042 0.38958 NaN 0.26887 0.21168 0.33629 0.8729 0.69317 0.93063
NaN NaN 0.59676 NaN NaN 0.40324 NaN 0.2692 0.22411 0.31843 0.59919 0.28776 0.77192
NaN NaN NaN NaN 0.64409 NaN 0.35591 0.26923 0.20975 0.33746 0.83805 0.66278 0.91973
NaN NaN 0.69446 NaN NaN NaN 0.30554 0.29945 0.25648 0.34758 0.51276 0.17915 0.68782
NaN NaN NaN NaN NaN 0.72989 0.27011 0.37203 0.29986 0.47089 0.64959 0.29331 0.78238
Sensitivities:
MSS ISS MSSD ISSD ITIT IC MI
_______ _______ ________ _______ _______ _______ _______
0.20029 0.51084 NaN NaN NaN NaN NaN
0.20029 NaN NaN 0.24854 NaN NaN NaN
0.20029 NaN NaN NaN 0.49307 NaN NaN
0.20029 NaN NaN NaN NaN NaN 0.12891
0.20029 NaN NaN NaN NaN 0.33066 NaN
0.20029 NaN 0.080273 NaN NaN NaN NaN
NaN 0.51084 0.080273 NaN NaN NaN NaN
NaN 0.51084 NaN NaN NaN 0.33066 NaN
NaN 0.51084 NaN NaN NaN NaN 0.12891
NaN 0.51084 NaN NaN 0.49307 NaN NaN
NaN 0.51084 NaN 0.24854 NaN NaN NaN
NaN NaN NaN 0.24854 0.49307 NaN NaN
NaN NaN 0.080273 0.24854 NaN NaN NaN
NaN NaN NaN 0.24854 NaN 0.33066 NaN
NaN NaN NaN 0.24854 NaN NaN 0.12891
NaN NaN 0.080273 NaN 0.49307 NaN NaN
NaN NaN NaN NaN 0.49307 0.33066 NaN
NaN NaN 0.080273 NaN NaN 0.33066 NaN
NaN NaN NaN NaN 0.49307 NaN 0.12891
NaN NaN 0.080273 NaN NaN NaN 0.12891
NaN NaN NaN NaN NaN 0.33066 0.12891
References:
A. W. Boyd, W. M. Whitmer, J. J. Soraghan, and M. A. Akeroyd. Auditory externalization in hearing-impaired listeners: The effect of pinna cues and number of talkers. J. Acoust. Soc. Am., 131(3):EL268--EL274, 2012. [ DOI | arXiv | www: ]
W. M. Hartmann and A. Wittenberg. On the externalization of sound images. J. Acoust. Soc. Am., 99(6):3678--88, June 1996. [ http ]
H. G. Hassager, F. Gran, and T. Dau. The role of spectral detail in the binaural transfer function on perceived externalization in a reverberant environment. J. Acoust. Soc. Am., 139(5):2992--3000, 2016. [ DOI | arXiv | www: ]


Build with Bootstrap