THE AUDITORY MODELING TOOLBOX
This documentation page applies to an outdated AMT version (1.1.0). Click here for the most recent page.
Go to function
EXP_HOHMANN2002 - figures from Hohmann (2012)
Usage
exp_hohmann(flags)
Description
exp_hohmann2002(flags) reproduces figures of the paper from Hohmann (2002).
The following flags can be specified:
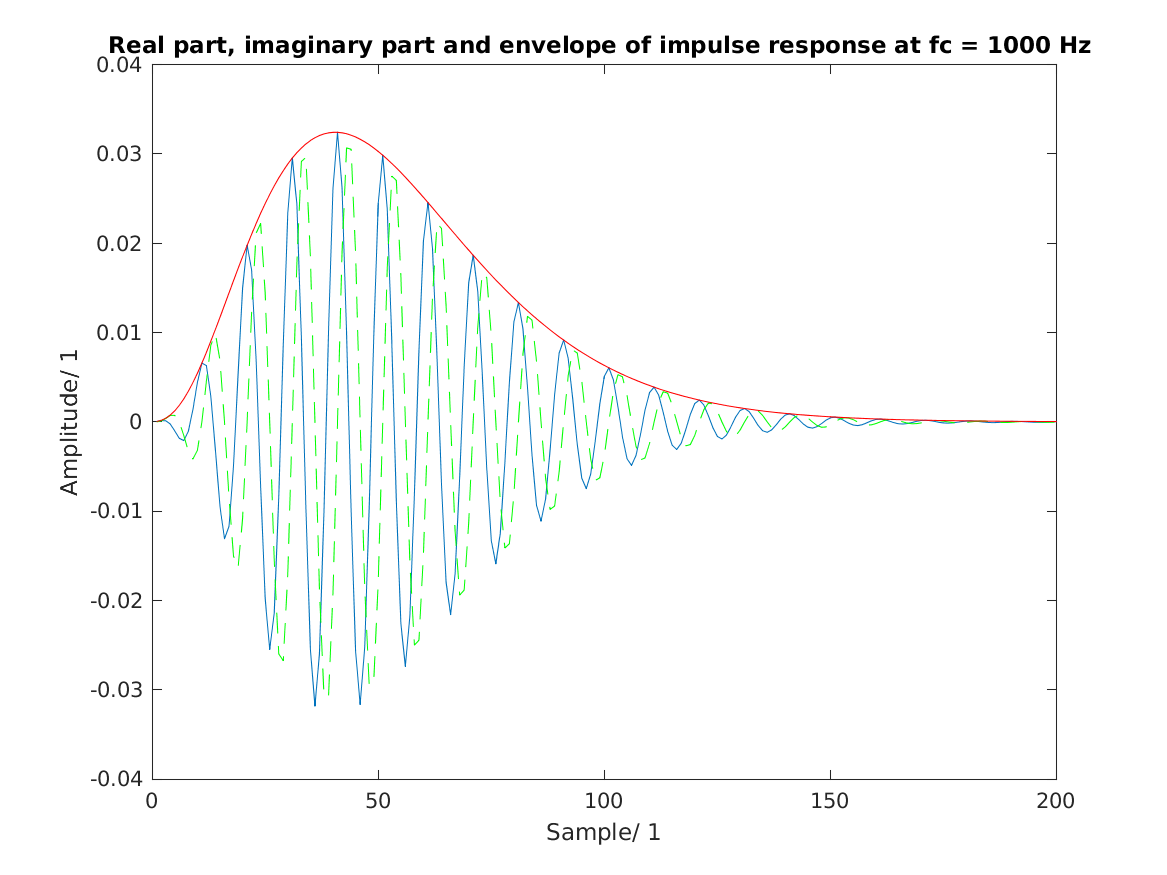
| 'fig1' | Reproduce Fig. 1: Impulse response of the example Gammatone filter (center frequency fc = 1000 Hz: 3-dB bandwidth fb = 100 Hz; sampling frequency fs = 10 kHz. Solid and dashed lines show the real and imaginary part of the filter output, respectively. The absolute value of the filter output (dashdotted line) clearly represents the envelope. |
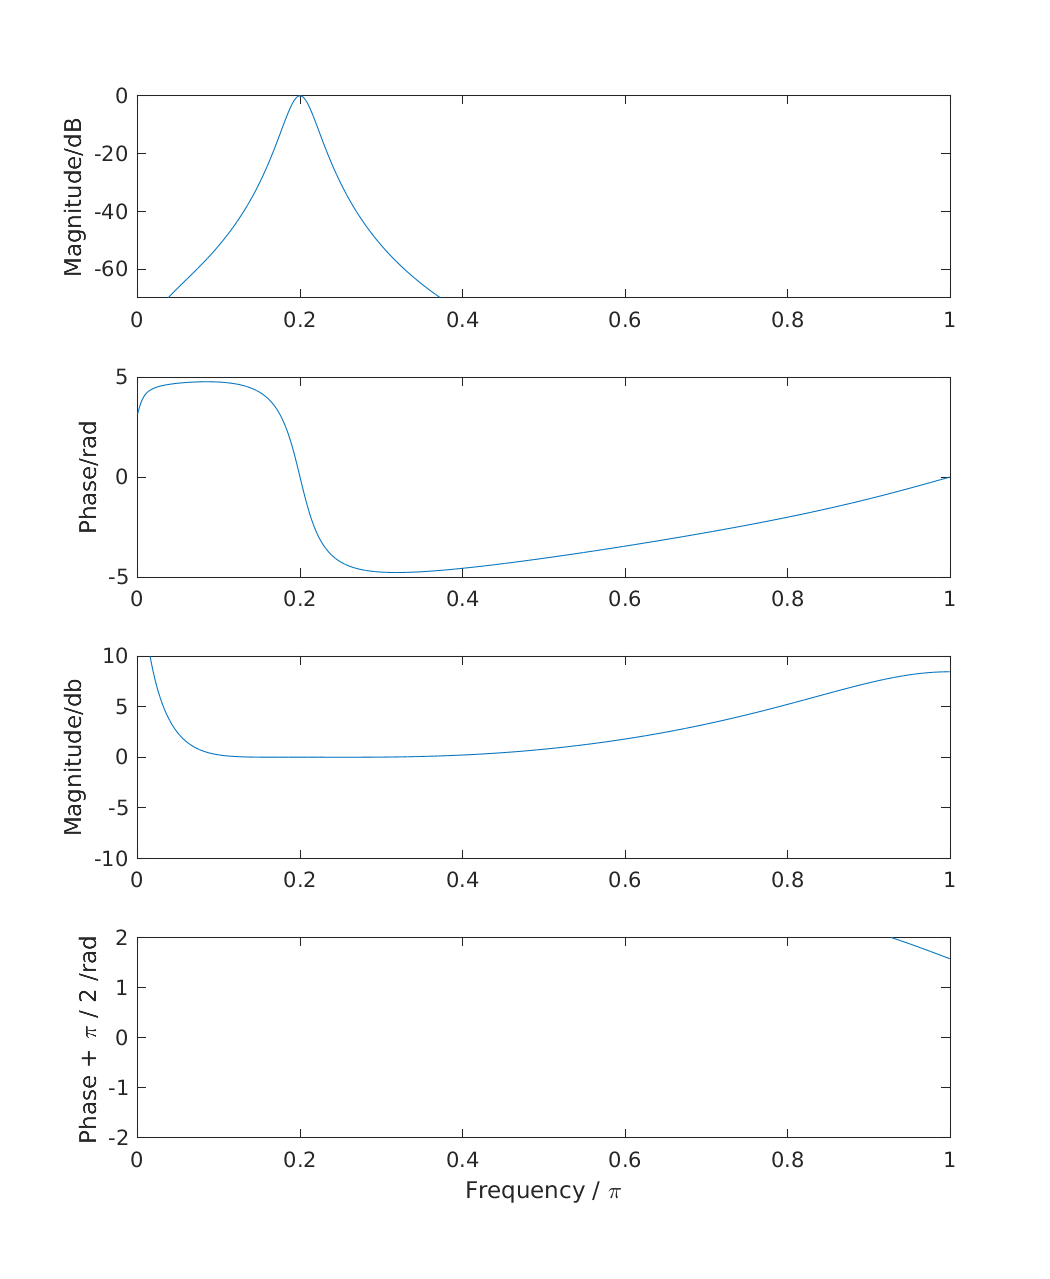
| 'fig2' | Reproduce Fig.2: Frequency response of the example Gammatone filter (upper two panels) and of the real-to-imaginary response(lower two panels). Pi/2 was added to the phase of the latter (see text). The frequency axis goes up to half the sampling rate (z=pi). |
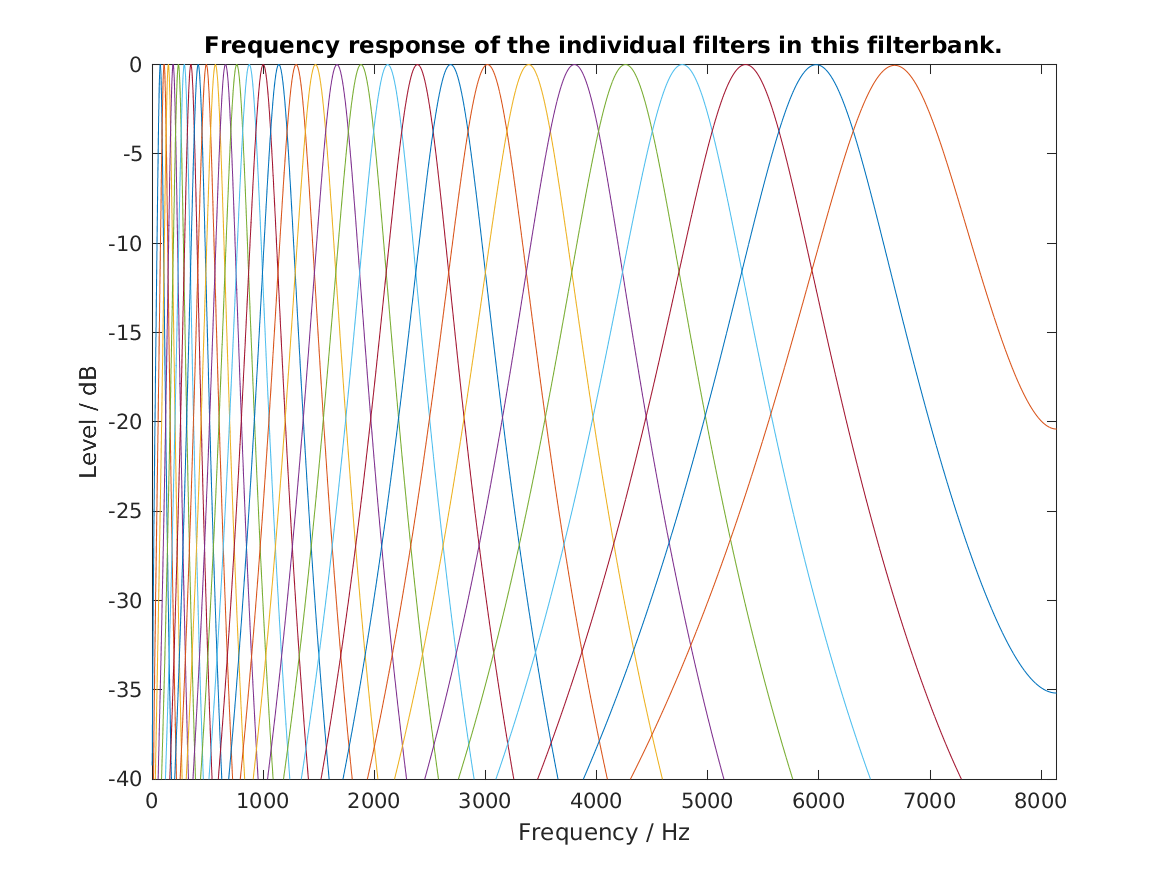
| 'fig3' | Reproduce Fig.3: Magnitude frequency response of the Gammatone filterbank. In this example, the filter channel density is 1 on the ERB scale and the filter bandwidth is 1 ERBaud. The sampling frequency was 16276Hz and the lower and upper boundary for the center frequencies were 70Hz and 6.7kHz, respectively. |
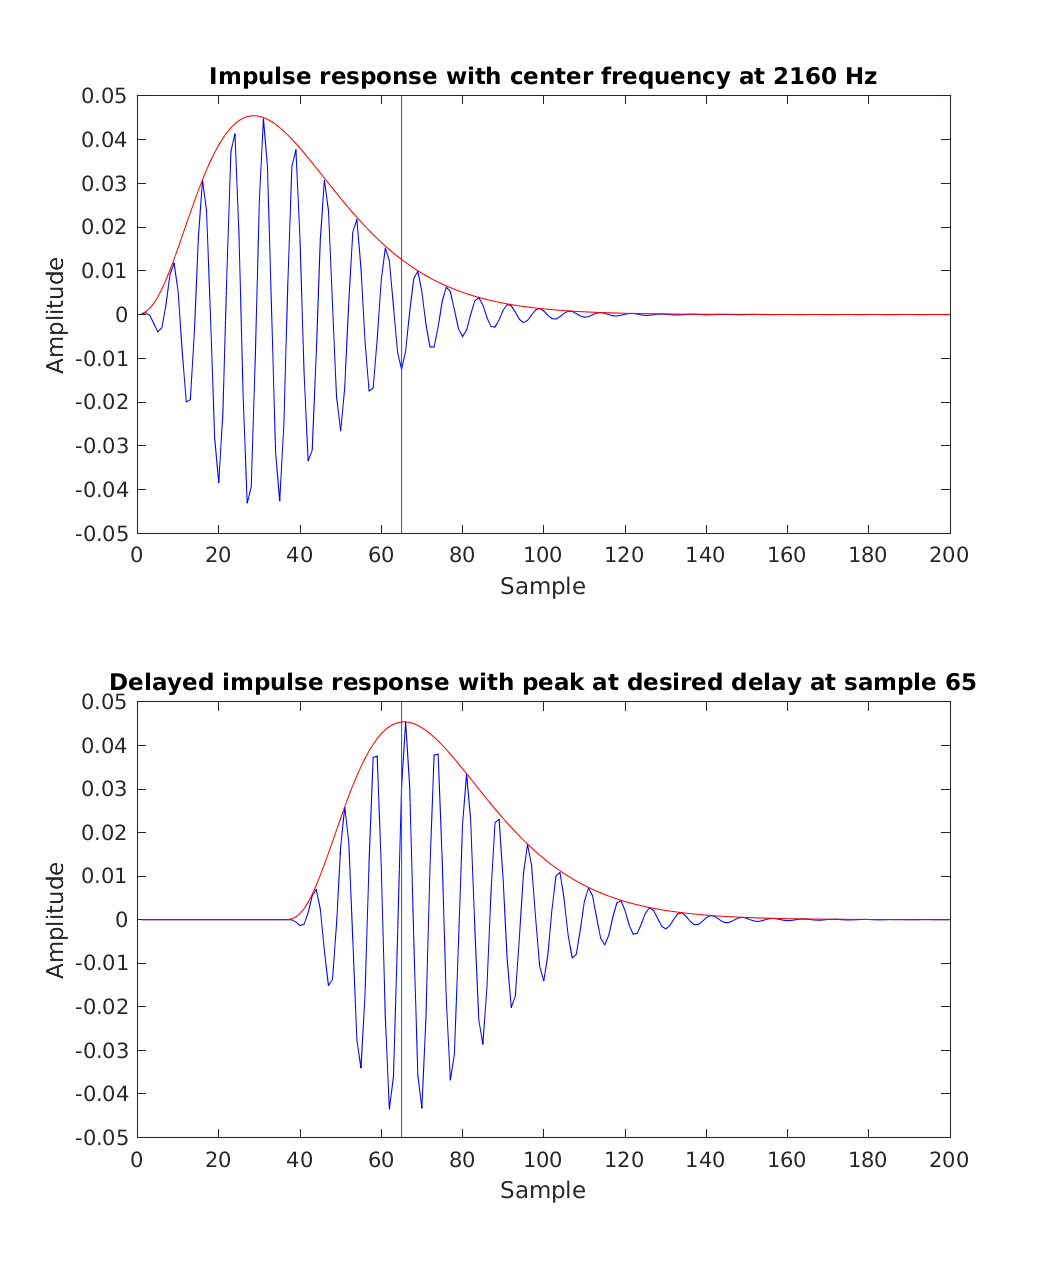
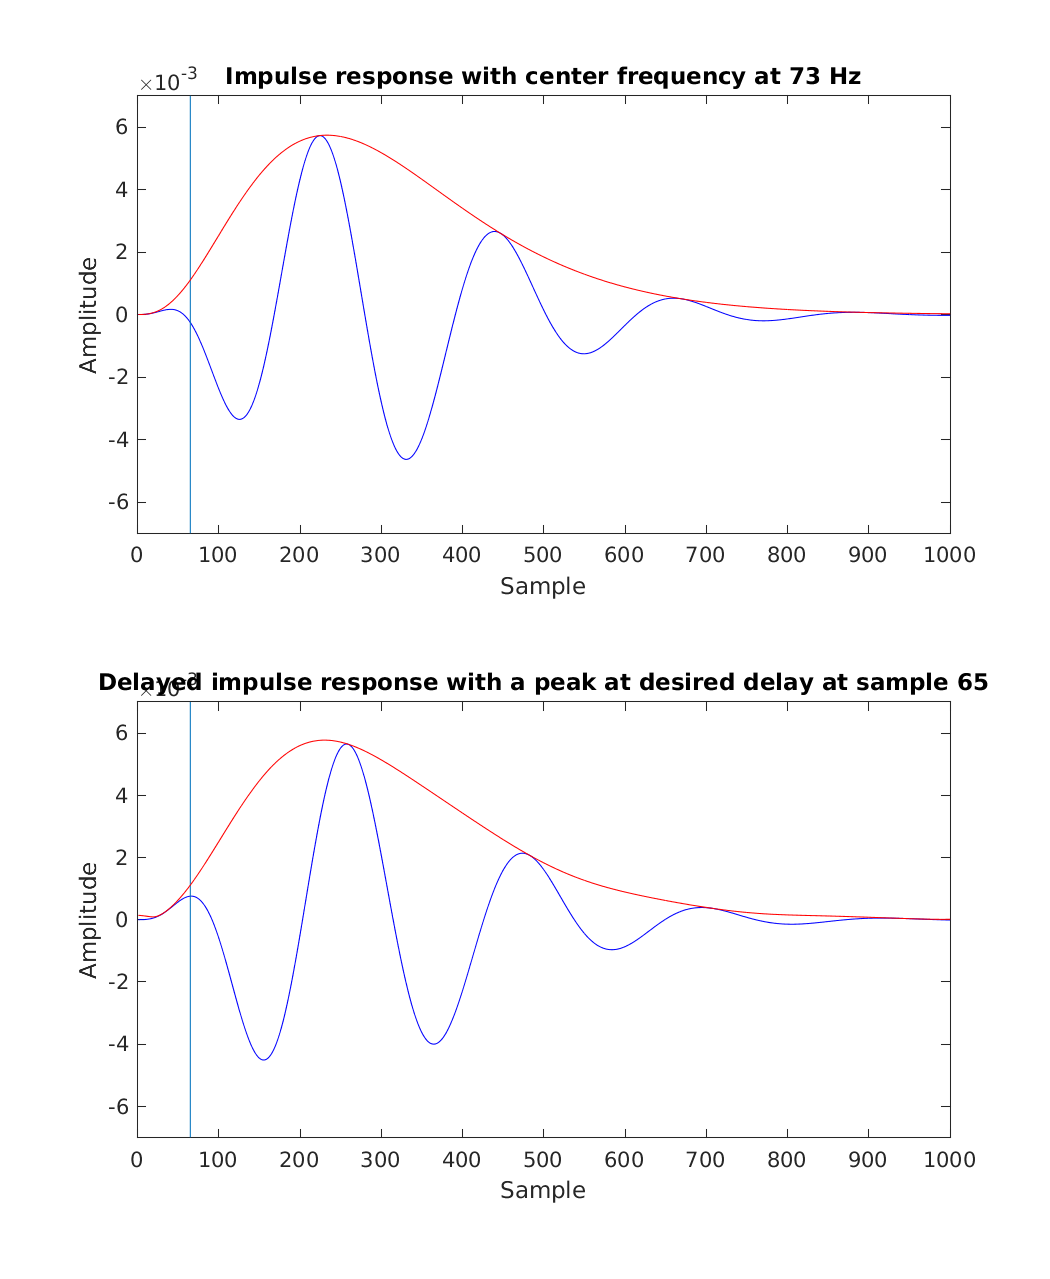
| 'fig4' | Reproduce Fig.4: Treatment of an impulse response with envelope maximum to the left of the desired group delay (at sample 65). The original complex impulse response (real part and envelope plotted in the upper panel) is multiplied with a complex factor and delayed so that the envelope maximum and the maximum of the real part coincide with the desired group delay (lower panel). |
| 'fig5' | Reproduce Fig.5: Treatment of an impulse response with envelope maximum to the right of the desired group delay (vertical line at sampling 65). The original complex impulse response ( real part and envelope plotted in the upper panel) is multiplied with a complex factor so that the maximum of the real part coincides with the desired group delay (lower panel). |
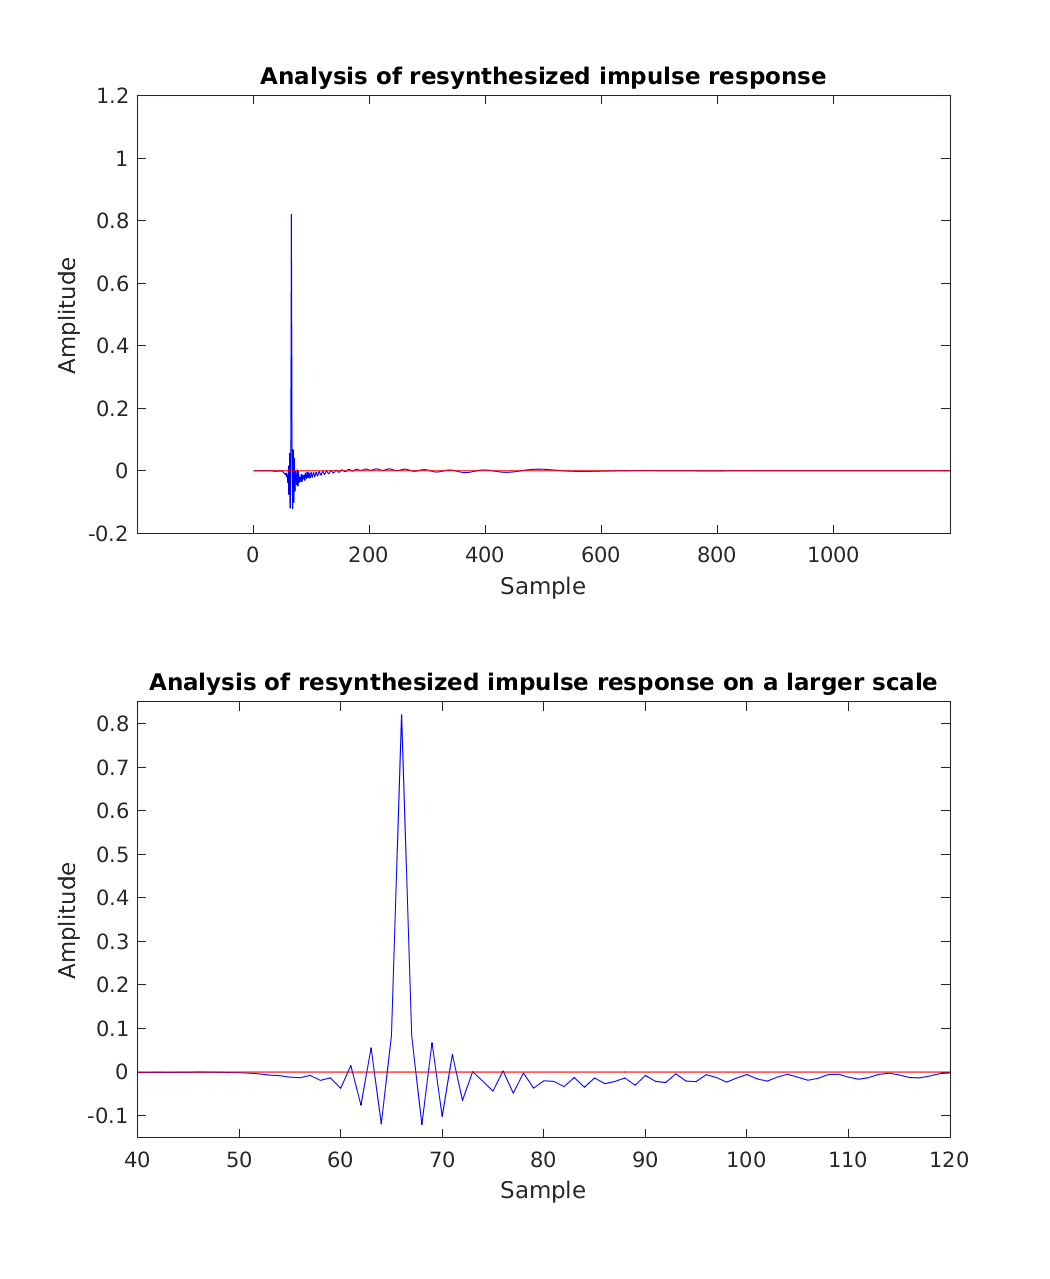
| 'fig6' | Reproduce Fig.6: Impulse response of the analysis-synthesis system using the filterbank design from section 3.1 (upper pannel). A peaked impulse is achieved at the desired group delay of 4 ms (65 samples at fs = 16276 Hz). The lower panel shows the main part of the response on a larger scale. |
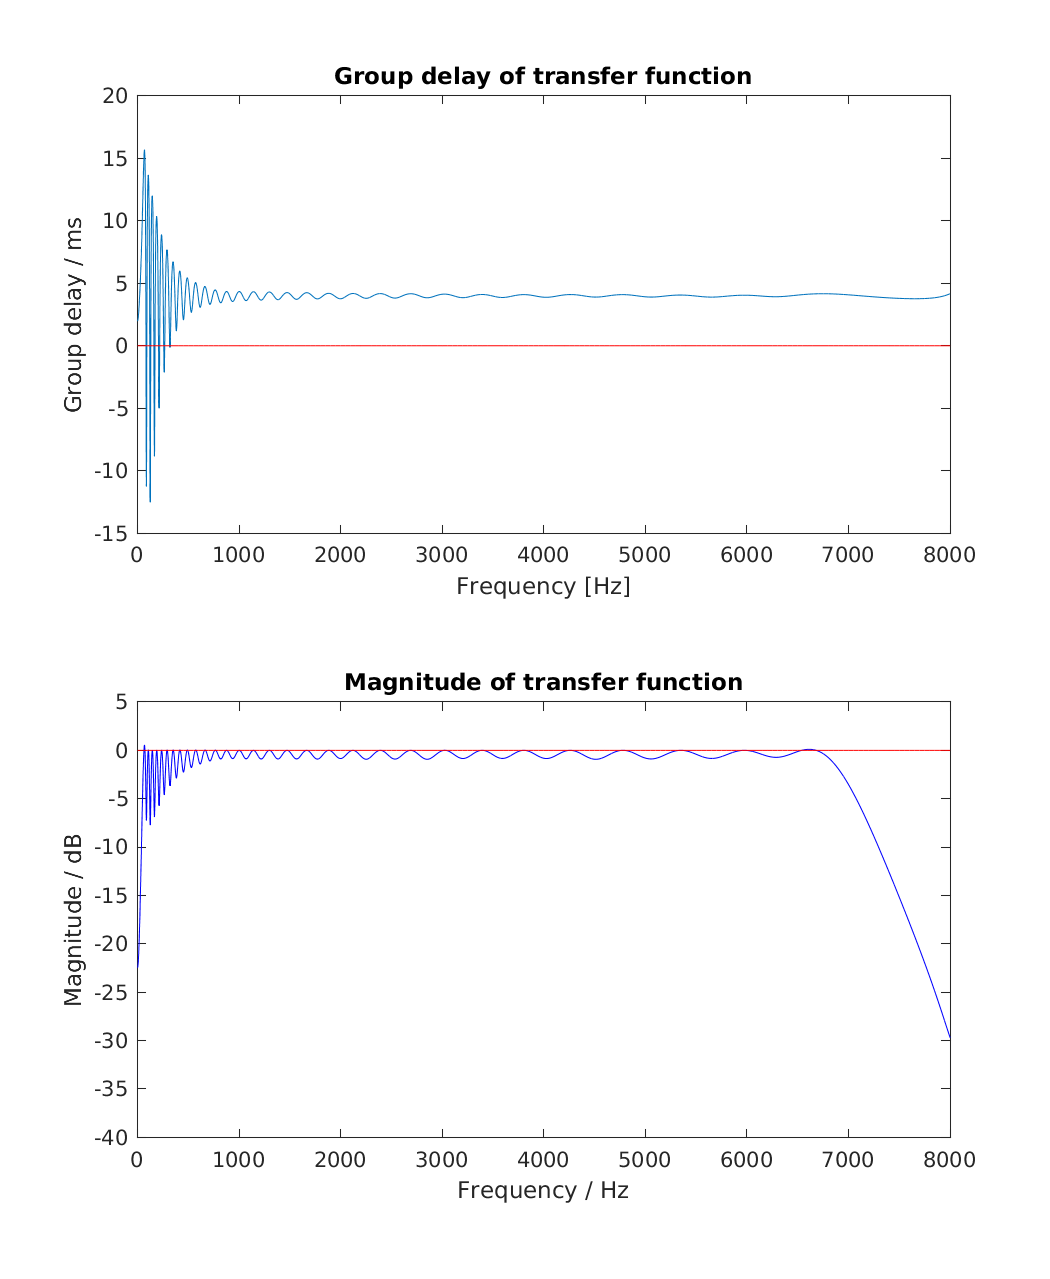
| 'fig7' | Reproduce Fig.7: Magnitude and group delay of the transfer function of the analysis-synthesis system using the filterbank design from section 3.1. |
Examples:
To display Fig. 1, use
exp_hohmann2002('fig1');
To display Fig. 2, use
exp_hohmann2002('fig2');
To display Fig. 3, use
exp_hohmann2002('fig3');
To display Fig. 4, use
exp_hohmann2002('fig4');
To display Fig. 5, use
exp_hohmann2002('fig5');
To display Fig. 6, use
exp_hohmann2002('fig6');
To display Fig. 7, use
exp_hohmann2002('fig7');
References:
V. Hohmann. Frequency analysis and synthesis using a gammatone filterbank. Acta Acustica united with Acoustica, 88(3):433--442, 2002.


Build with Bootstrap