THE AUDITORY MODELING TOOLBOX
This documentation page applies to an outdated AMT version (1.1.0). Click here for the most recent page.
EXP_LANGENDIJK2002 - Experiment from Langendijk & Bronkhorst (2002)
Usage
output = exp_langendijk2002(flag);
Description
exp_langendijk2002(flags) recreates figures from Langendijk & Bronkhorst (2002)
The following flags can be specified;
| 'plot' | Plot the output of the experiment. This is the default. |
| 'no_plot' | Don't plot, only return data. |
| 'fig7' | Listener P6 |
| 'fig9' | Listener P3 |
You can choose between two of his listeners P3 and P6. The required data (DTF data and response patterns) will be provided by precalculated mat-files due to high computing time (optionally data can be recalculated by using data_langendijk2002.
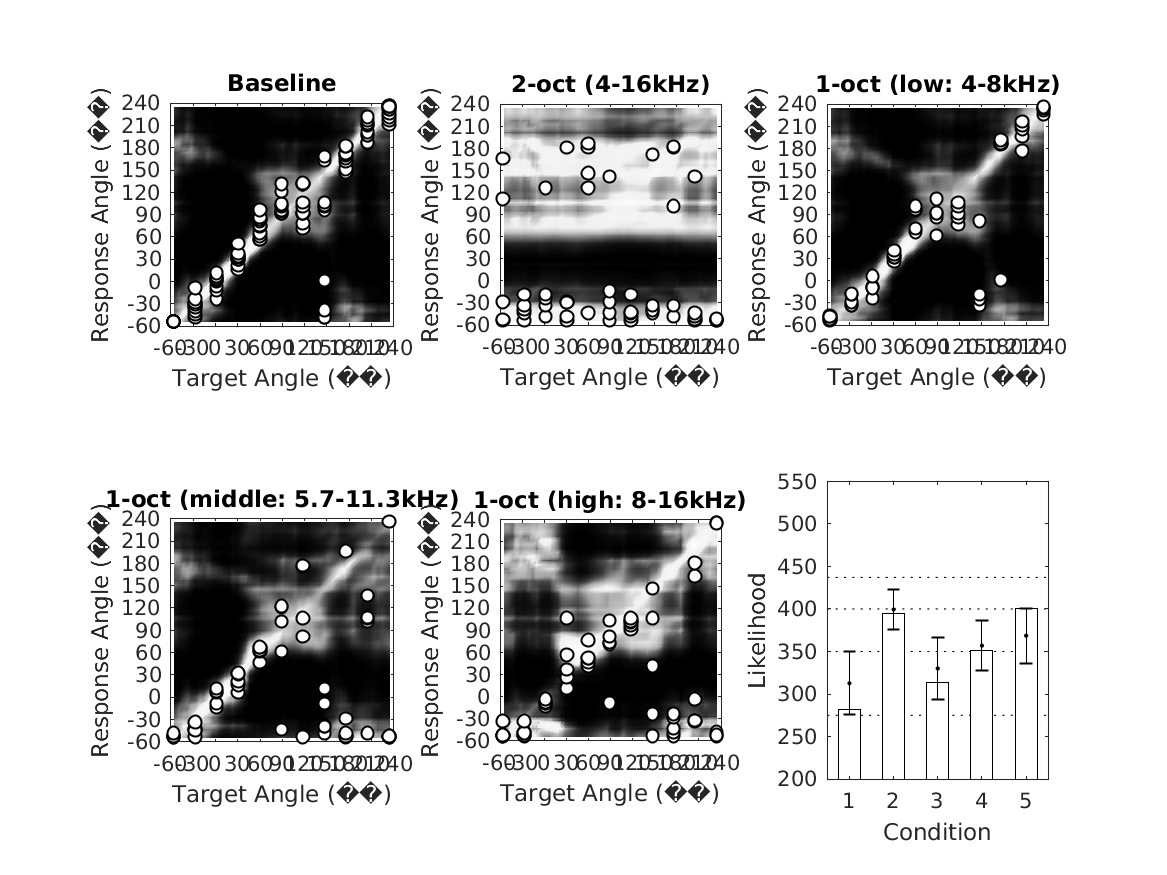
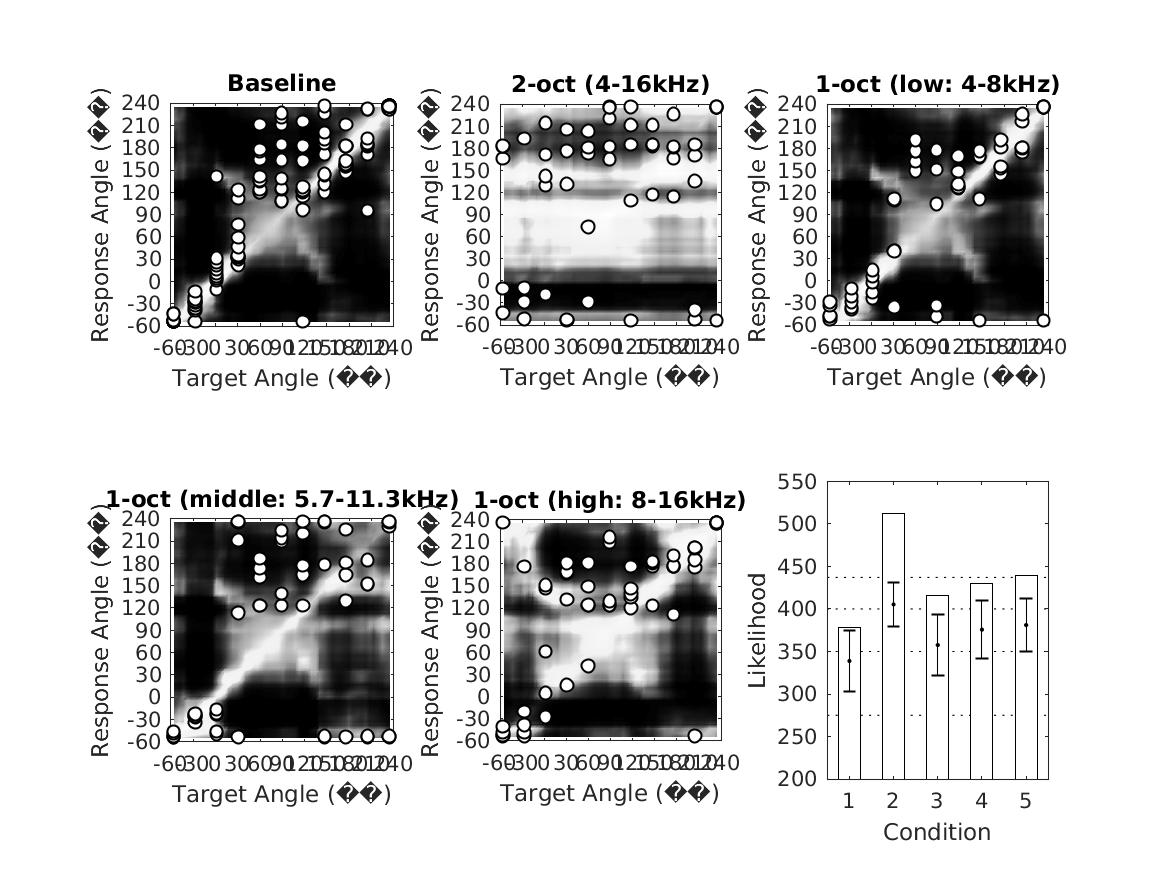
The following subfigures show the probability density functions (PDFs) and actual response angles as functions of the target angle for the exemplary listener and different conditions. The shading of each cell codes the response probability (light/dark denotes high/low probability):
- Subfigure 1: Baseline condition
- Subfigure 2: 2-octave condition (4-16kHz)
- Subfigure 3: 1-octave condition (low 4-8kHz)
- Subfigure 4: 1-octave condition (middle 5.7-11.3kHz)
- Subfigure 5: 1-octave condition (high 8-16kHz)
Subfigure 6 shows the likelihood statistics for the actual responses (bars) in comparison to the means (dots) and the 99% confidence intervals (whiskers) of the expected likelihood. See paper for further details about the likelihood statistics.
The output are the pdfs for the baseline condition.
Examples:
To display Figure 7 use
exp_langendijk2002('fig7');
To display Figure 9 use
exp_langendijk2002('fig9');
References:
E. Langendijk and A. Bronkhorst. Contribution of spectral cues to human sound localization. J. Acoust. Soc. Am., 112:1583--1596, 2002.


Build with Bootstrap