THE AUDITORY MODELING TOOLBOX
This documentation page applies to an outdated AMT version (1.2.0). Click here for the most recent page.
Go to function
DATA_WIERSTORF2013 - Data points from the Wierstorf (2013) book chapter
Usage
data = data_wierstorf2013_data(flag)
Output parameters
| data | the data points from the given figure as columns of a matrix. The x axis is alway the first column, followed by data and for example confident intervals. Which kind of data is stored in which column is indicated by the description string. |
| description | string that describes the type and unit of the data represented in every column of the data matrix |
Description
data_wierstorf2013(flag) returns data points from the Wierstorf 2013 book chapter. The flag may be one of:
| 'no_plot' | Don't plot, only return data. This is the default. |
| 'plot' | Plot the data. |
| 'itd2angle_lookuptable' | |
| Return the data for the ITD-to-angle look-up. | |
| 'fig6' | Return data from Fig. 6. The data describes the difference between the azimuth angle of the auditory event and the azimuth angle of the sound event for different incidence angles of the sound event. The data was collected with real loudspeakers as sound events and for via binaural synthesis simulated loudspeakers as sound event. |
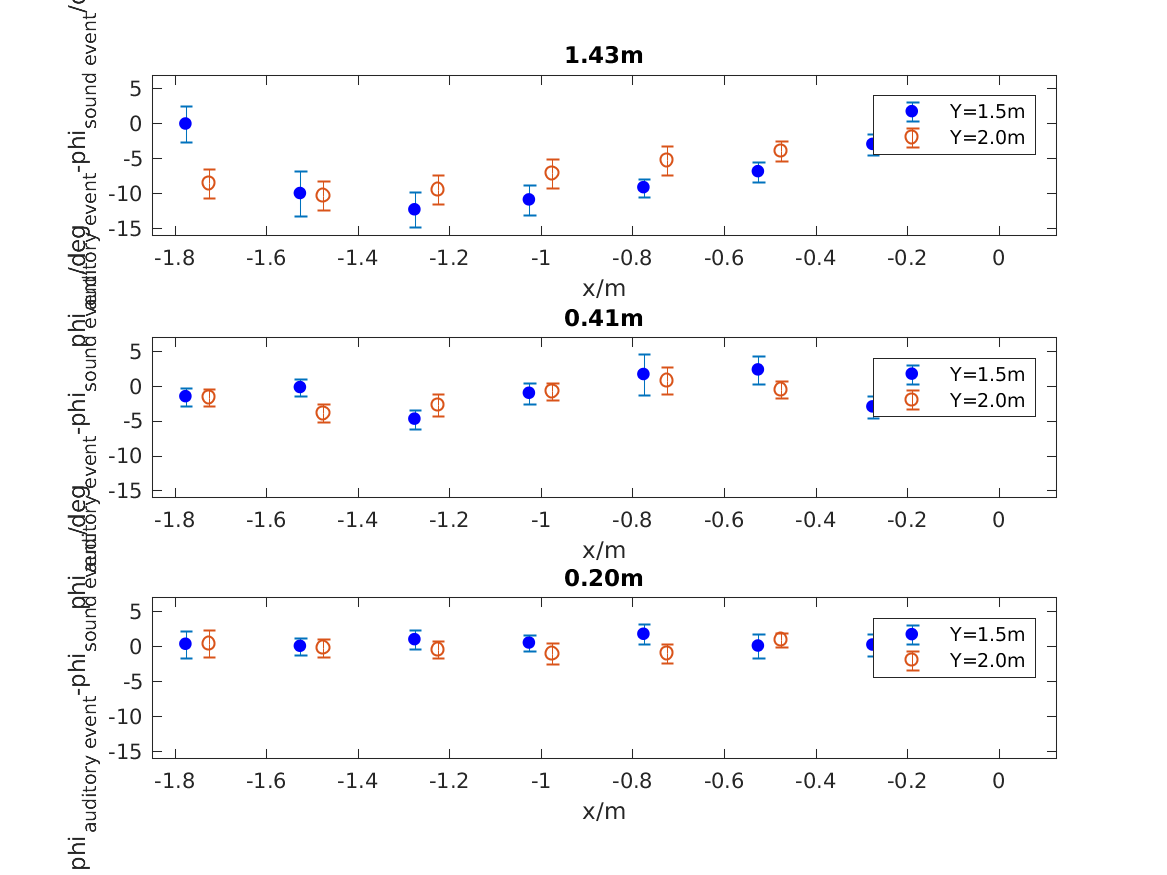
| 'fig7' | Return data from Fig. 7. The data descirbes the result of a listening test measuring the localization performance for Wave Field Synthesis setups at 16 different positions in the listening area. The data comes for three different loudspeaker arrays consisting of 3, 8, or 15 loudspeakers. Note: these are the same data as from Fig. 10. |
| 'fig10' | Return data from Fig. 10. The data descirbes the result of a listening test measuring the localization performance for Wave Field Synthesis setups at 16 different positions in the listening area. The data comes for three different loudspeaker arrays consisting of 3, 8, or 15 loudspeakers. Note: these are the same data as from Fig. 7. |
If no flag is given, the function will print the list of valid flags.
Examples:
Figure 6 can be displayed using
data_wierstorf2013('fig6','plot');
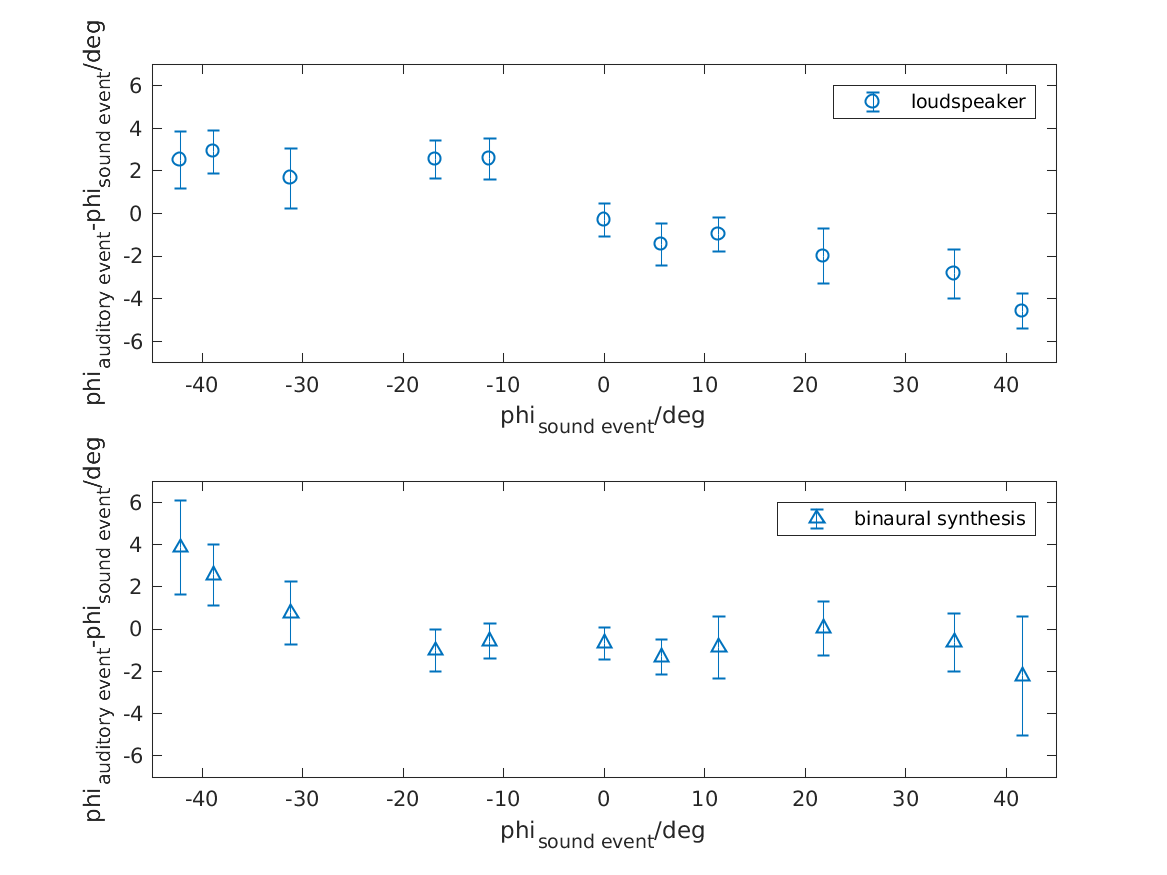
Figure 7 can be displayed using
data_wierstorf2013('fig7','plot');
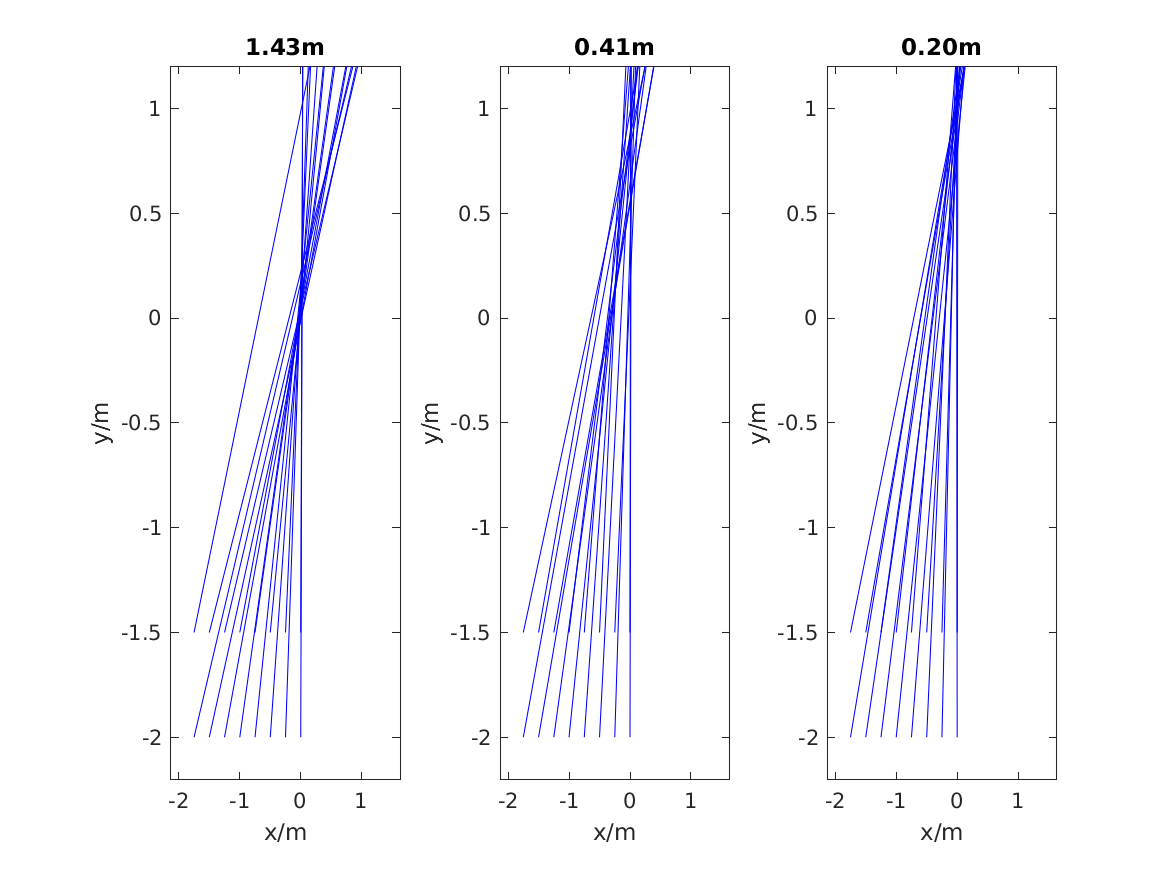
Figure 10 can be displayed using
data_wierstorf2013('fig10','plot');
References:
H. Wierstorf, A. Raake, and S. Spors. Binaural assessment of multi-channel reproduction. In J. Blauert, editor, The technology of binaural listening, chapter 10. Springer, Berlin--Heidelberg--New York NY, 2013.


Build with Bootstrap