THE AUDITORY MODELING TOOLBOX
This documentation page applies to an outdated AMT version (1.2.0). Click here for the most recent page.
EXP_BAUMGARTNER2015 - Results from Baumgartner and Majdak (2015)
Usage
data = exp_baumgartner2015(flag)
Description
exp_baumgartner2015(flag) reproduces figures of the studies from Baumgartner et al. (2015).
The following flags can be specified
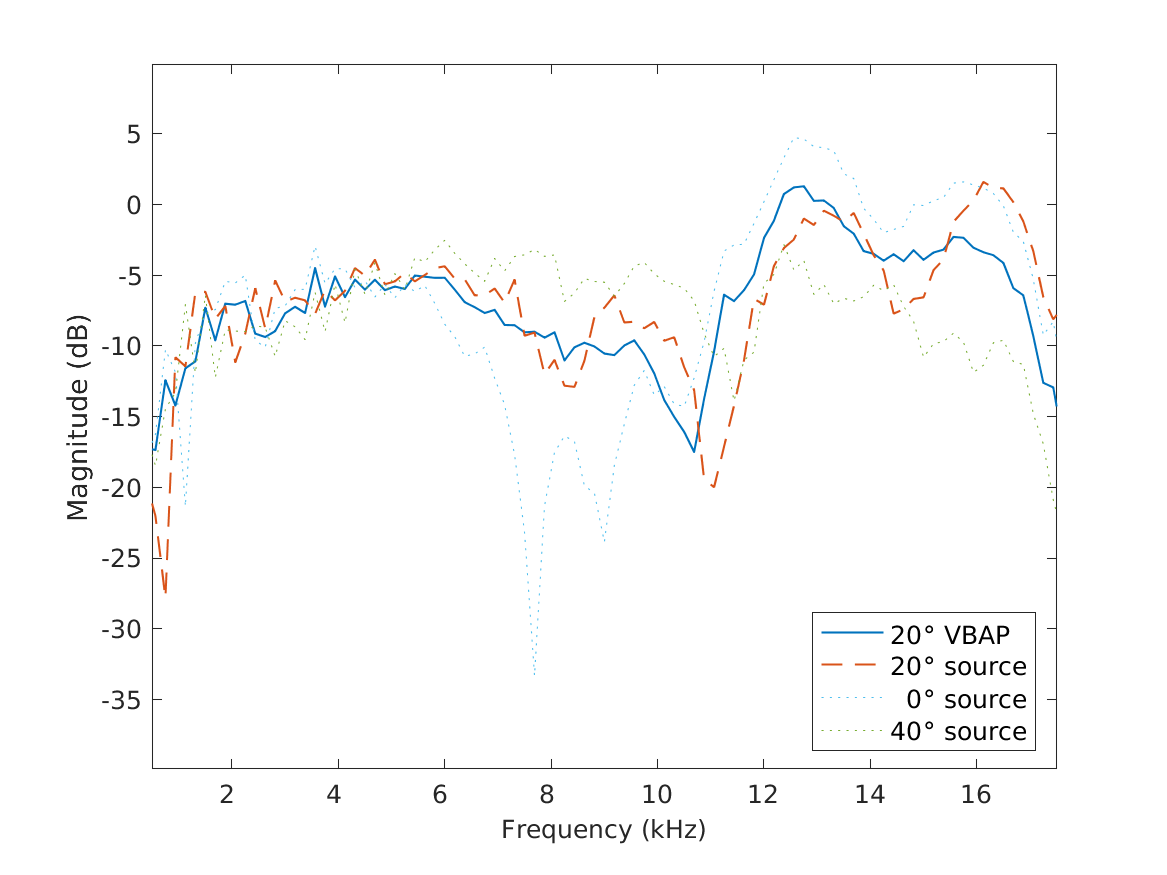
| 'fig2' | Reproduce Fig.2 of Baumgartner and Majdak (2015): Example showing the spectral discrepancies obtained by VBAP. The targeted spectrum is the HRTF for 20 deg polar angle. The spectrum obtained by VBAP is the superposition of two HRTFs from directions 40 deg polar angle apart of each other with the tar- geted source direction centered in between. |
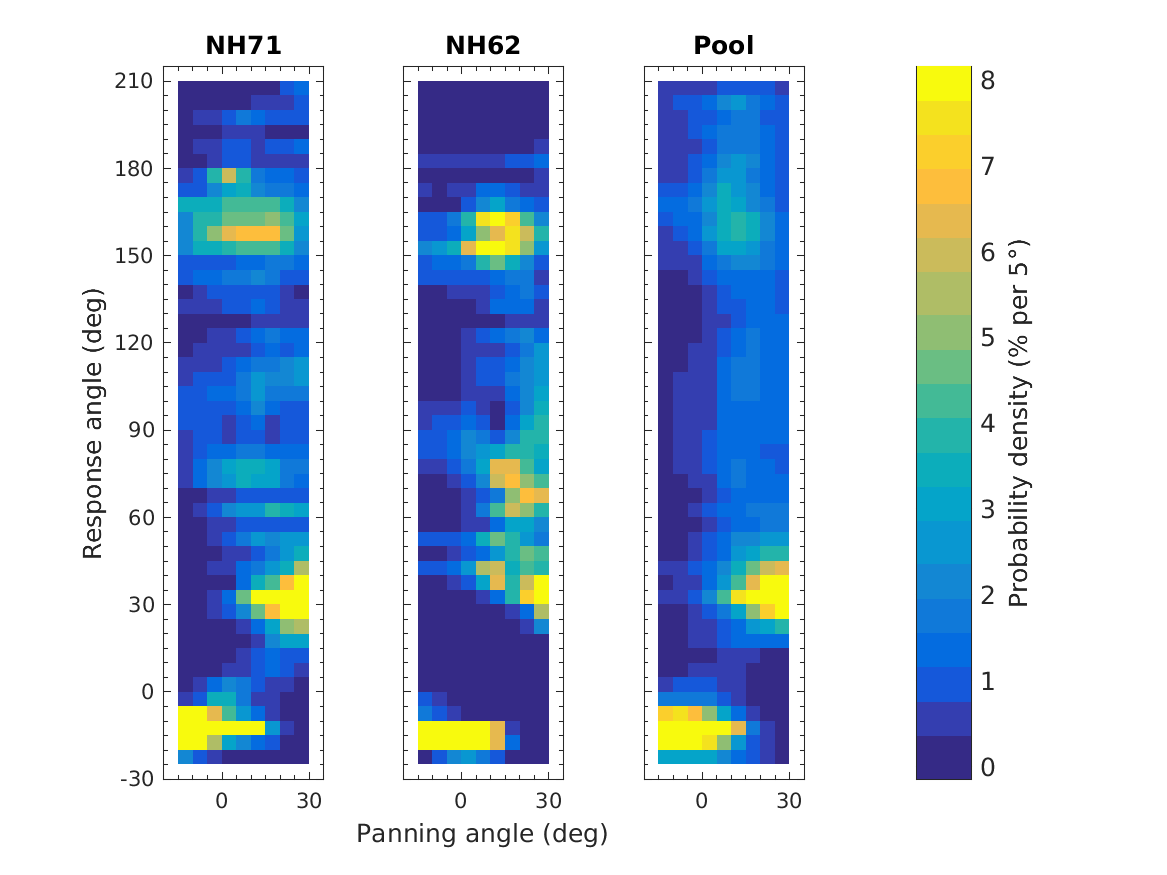
| 'fig4' | Reproduce Fig.4 of Baumgartner and Majdak (2015): Response predictions to sounds created by VBAP with two loudspeakers in the median plane positioned at polar angles of -15 and 30 deg, respectively. Predictions for two exemplary listeners and pooled across all listeners. Each column of a panel shows the predicted PMV of polar-angle responses to a certain sound. Note the inter-individual differences and the generally small probabilities at response angles not occupied by the loudspeakers. |
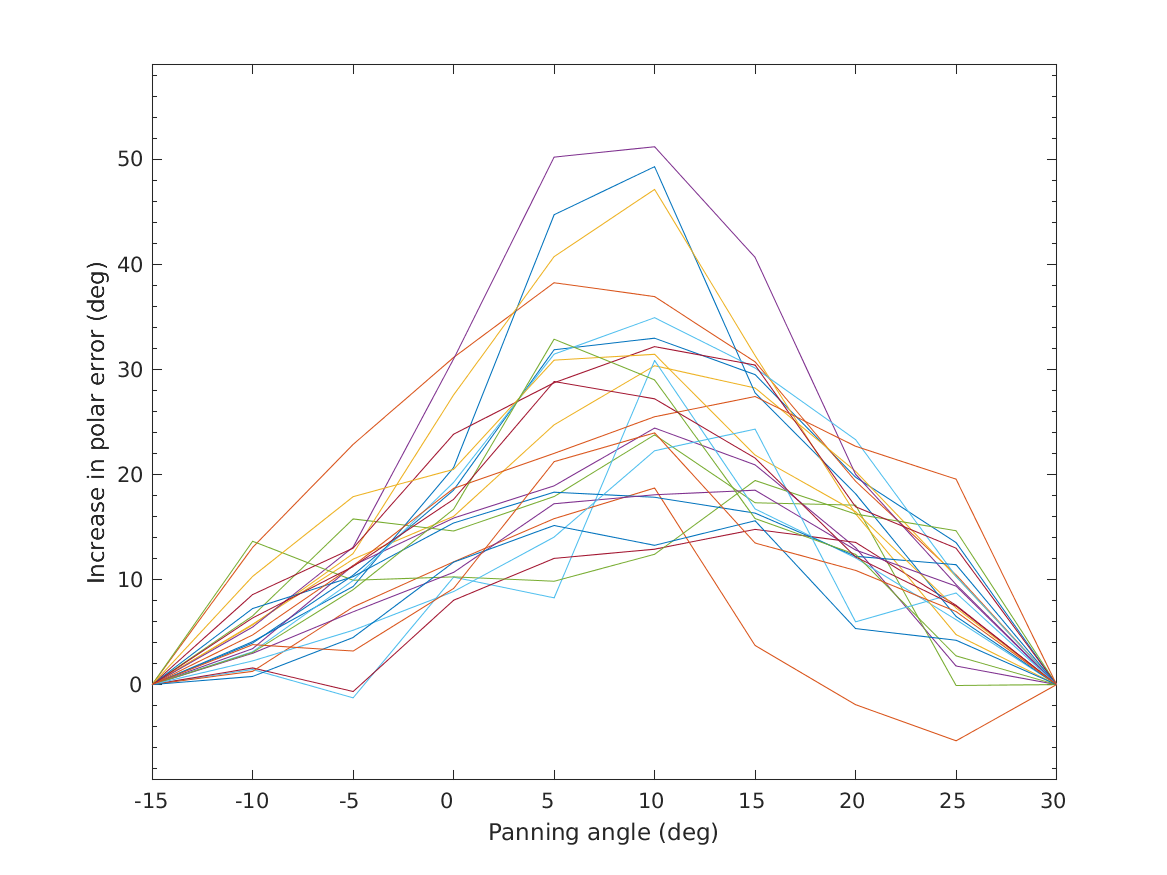
| 'fig5' | Reproduce Fig.5 of Baumgartner and Majdak (2015): Listener-specific increases in polar error as a function of the panning angle. Increase in polar error defined as the difference between the polar error obtained by the VBAP source and the polar error obtained by the real source at the corresponding panning angle. Same loudspeaker arrangement as for Fig. 4. Note the large inter-individual differences and the increase in polar error being largest at panning angles centered between the loudspeakers, i.e., at panning ratios around R = 0 dB. |
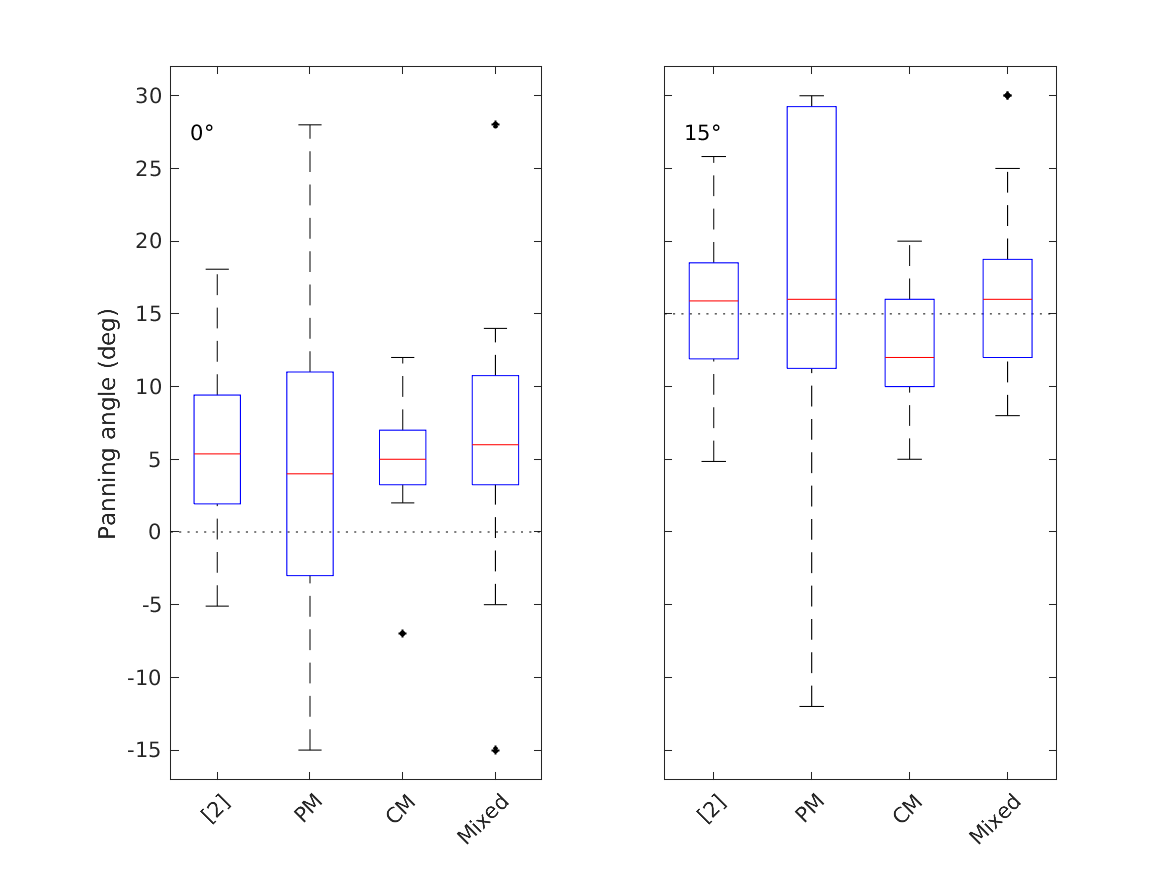
| 'fig6' | Reproduce Fig.6 of Baumgartner and Majdak (2015): Panning angles for the loudspeaker arrangement of Fig. 4 judged best for reference sources at polar angles of 0 or 15 deg in the median plane. Comparison between experimental results from [2] and simulated results based on various response strategies: PM, CM, and both mixed. Dotted horizontal line: polar angle of the reference source. Hor- izontal line within box: median; box: inter-quartile range (IQR); whisker: within quartile \(\pm 1.5\) IQR; star: outlier. Note that the simulations predicted a bias similar to the results from Pulkki (2001) for the reference source at 0 deg. |
| 'tab1' | Reproduce Tab.1 of Baumgartner and Majdak (2015): Means and standard deviations of responded panning angles for the two reference sources (Ref.) together with corresponding GOFs evaluated for the actual results from Pulkki (2001) and predicted results based on various response strategies. Note the relatively large GOFs for the simulations based on mixed response strategies indicating a good correspondence between actual and predicted results. |
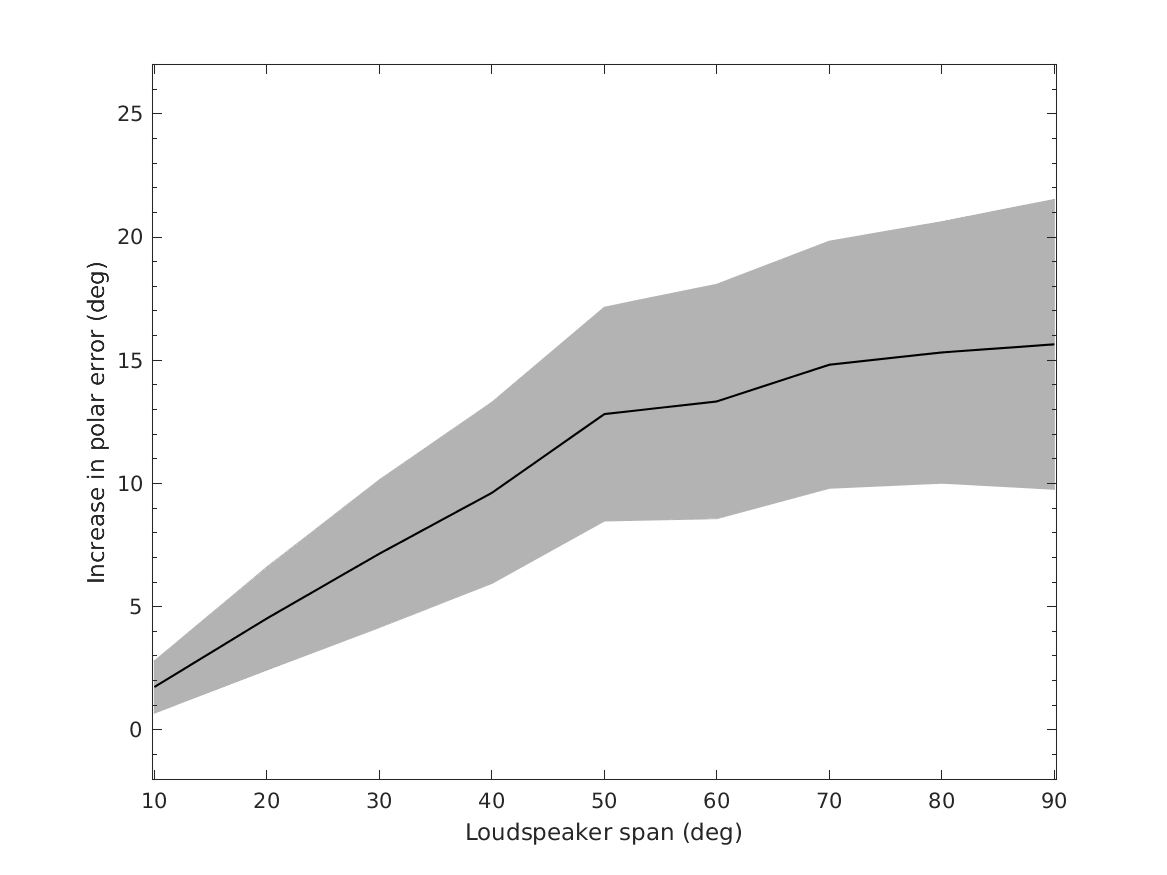
| 'fig7' | Reproduce Fig.7 of Baumgartner and Majdak (2015): Increase in polar error (defined as in Fig. 5) as a function of loudspeaker span in the median plane with panning ratio R = 0 dB. Black line with gray area indicates mean \(\pm 1\) standard deviation across listeners. Note that the increase in polar error monotonically increases with loudspeaker span. |
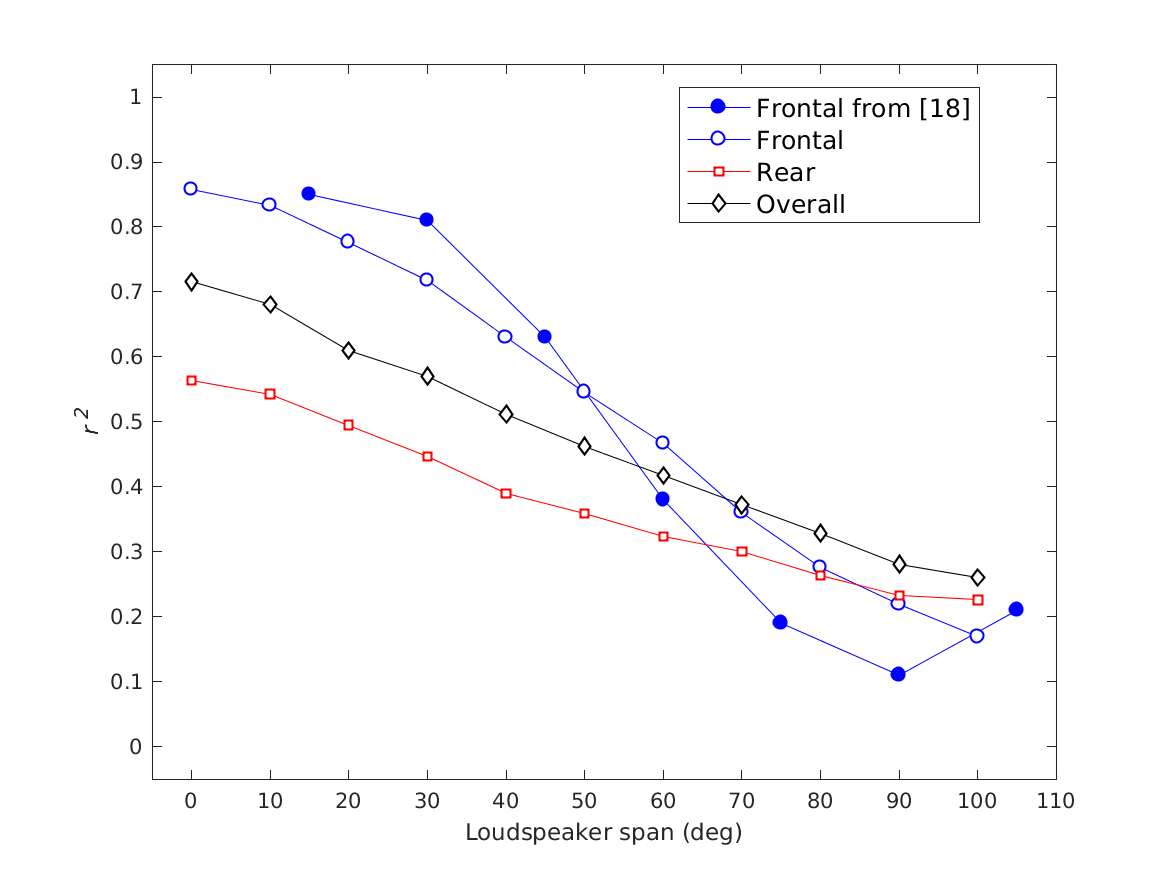
| 'fig8' | Reproduce Fig.8 of Baumgartner and Majdak (2015): Effect of loudspeaker span in the median plane on coefficient of determination, r^2, for virtual source directions created by VBAP. Separate analysis for frontal, rear, and overall (frontal and rear) targets. Data pooled across listeners. Note the correspondence with the results obtained by Bremen et al. (2010). |
| 'tab3' | Reproduce Tab.3 of Baumgartner and Majdak (2015): Predicted across-listener average of increase in polar errors as referred to a reference system containing loudspeakers at all considered directions. Distinction between mean and maximum degradation across directions. N: Number of loudspeakers. Ele.: Elevation of second layer. Notice that this elevation has a larger effect on mean and maximum degradation than N. |
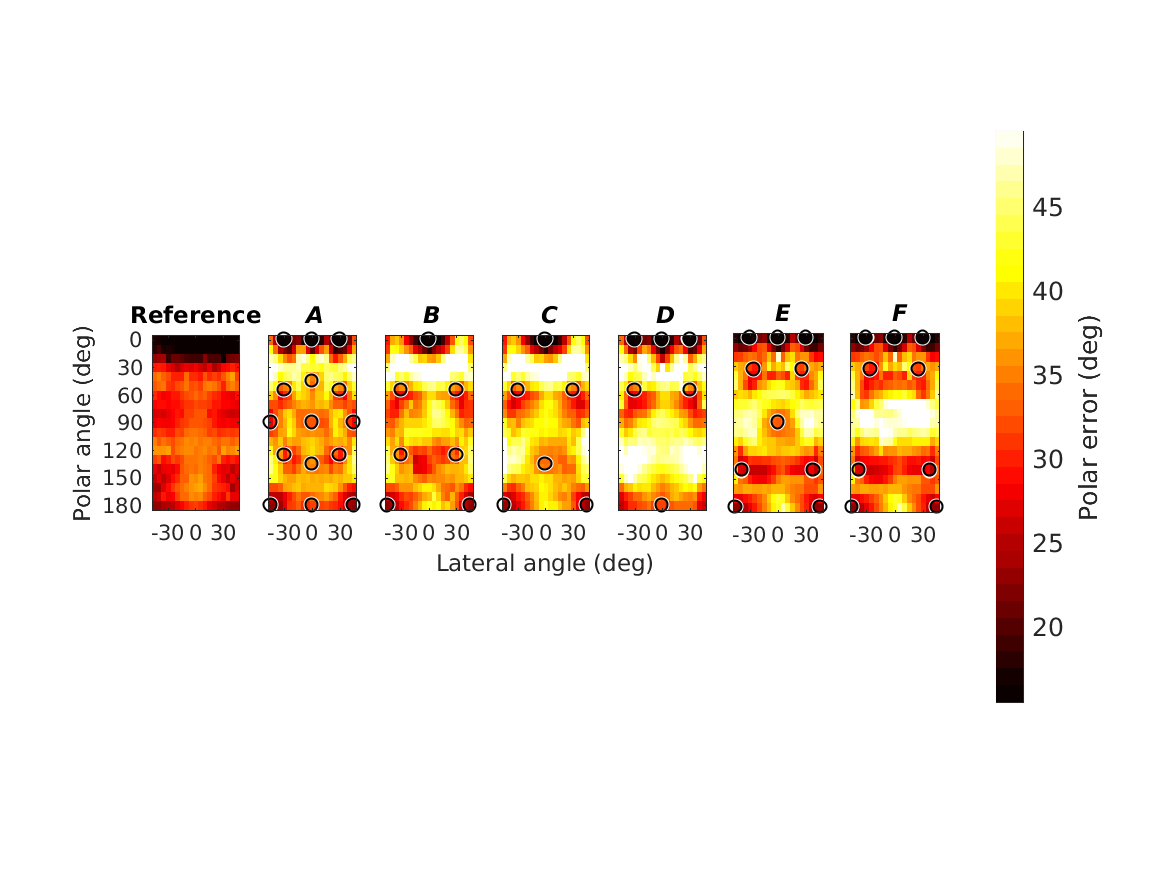
| 'fig9' | Reproduce Fig.9 of Baumgartner and Majdak (2015): Predicted polar error as a function of the lateral and polar angle of a virtual source created by VBAP in various multichannel systems. Open circles indicate loudspeaker directions. Reference shows polar error predicted for a real source placed at the virtual source directions investigated for systems A, ..., F. |
Further, cache flags (see amt_cache) and plot flags can be specified:
| 'plot' | Plot the output of the experiment. This is the default. |
| 'no_plot' | Don't plot, only return data. |
Requirements:
- SOFA API v0.4.3 or higher from http://sourceforge.net/projects/sofacoustics for Matlab (in e.g. thirdparty/SOFA)
- Data in hrtf/baumgartner2014
- Statistics Toolbox for Matlab (for some of the figures)
Examples:
To display Fig.2 of Baumgartner and Majdak (2015) use
exp_baumgartner2015('fig2');
To display Fig.4 of Baumgartner and Majdak (2015) use
exp_baumgartner2015('fig4');
To display Fig.5 of Baumgartner and Majdak (2015) use
exp_baumgartner2015('fig5');
To display Fig.6 of Baumgartner and Majdak (2015) use
exp_baumgartner2015('fig6');
To display Fig.7 of Baumgartner and Majdak (2015) use
exp_baumgartner2015('fig7');
To display Fig.8 of Baumgartner and Majdak (2015) use
exp_baumgartner2015('fig8');
To display Fig.9 of Baumgartner and Majdak (2015) use
exp_baumgartner2015('fig9');
To display Tab.1 of Baumgartner and Majdak (2015) use
exp_baumgartner2015('tab1');
This code produces the following output:
p-values of K.S.-test:
Real source at 0 deg:
  Results Pulkki (2001): p = 0.77
  Probability Maximiz.:  p = 0.06
  Centroid Match:        p = 0.19
  Individual strategy:   p = 0.93 (#CM = 13)
Real source at 15 deg:
  Results Pulkki (2001): p = 0.70
  Probability Maximi.:   p = 0.00
  Centroid Match:        p = 0.00
  Individual strategy:   p = 0.94 (#CM = 13)
To display Tab.3 of Baumgartner and Majdak (2015) use
exp_baumgartner2015('tab3');
This code produces the following output:
RMS error difference from reference averaged across directions
System  min  mean  max
\it A -7.0 6.7 28.8
\it B -7.3 8.9 38.6
\it C -2.9 10.0 38.6
\it D -2.6 11.0 31.3
\it E -7.3 6.4 29.3
\it F -6.5 7.3 29.3
References:
R. Baumgartner, P. Majdak, and B. Laback. Modeling sound-source localization in sagittal planes for human listeners. The Journal of the Acoustical Society of America, 136(2):791--802, 2014. [ DOI ]
R. Baumgartner and P. Majdak. Modeling Localization of Amplitude-Panned Virtual Sources in Sagittal Planes. J. Audio Eng. Soc., 63(7/8):562--569, Aug. 2015. [ DOI | http ]
P. Bremen, M. M. van Wanrooij, and A. J. van Opstal. Pinna cues determine orientation response modes to synchronous sounds in elevation. J. Neurosci., 30 (1):194--204, 2010. [ DOI ]
V. Pulkki. Localization of Amplitude-Panned Virtual Sources II: Two- and Three-Dimensional Panning. J. Audio Eng. Soc., 49(4):753--767, 2001.


Build with Bootstrap