THE AUDITORY MODELING TOOLBOX
This documentation page applies to an outdated AMT version (1.2.0). Click here for the most recent page.
EXP_BAUMGARTNER2021 - Simulations of Baumgartner and Majdak (2021)
Usage
data = exp_baumgartner2021(flag)
Description
exp_baumgartner2021(flag) reproduces figures of the study from Baumgartner and Majdak (2021).
The following flags can be specified
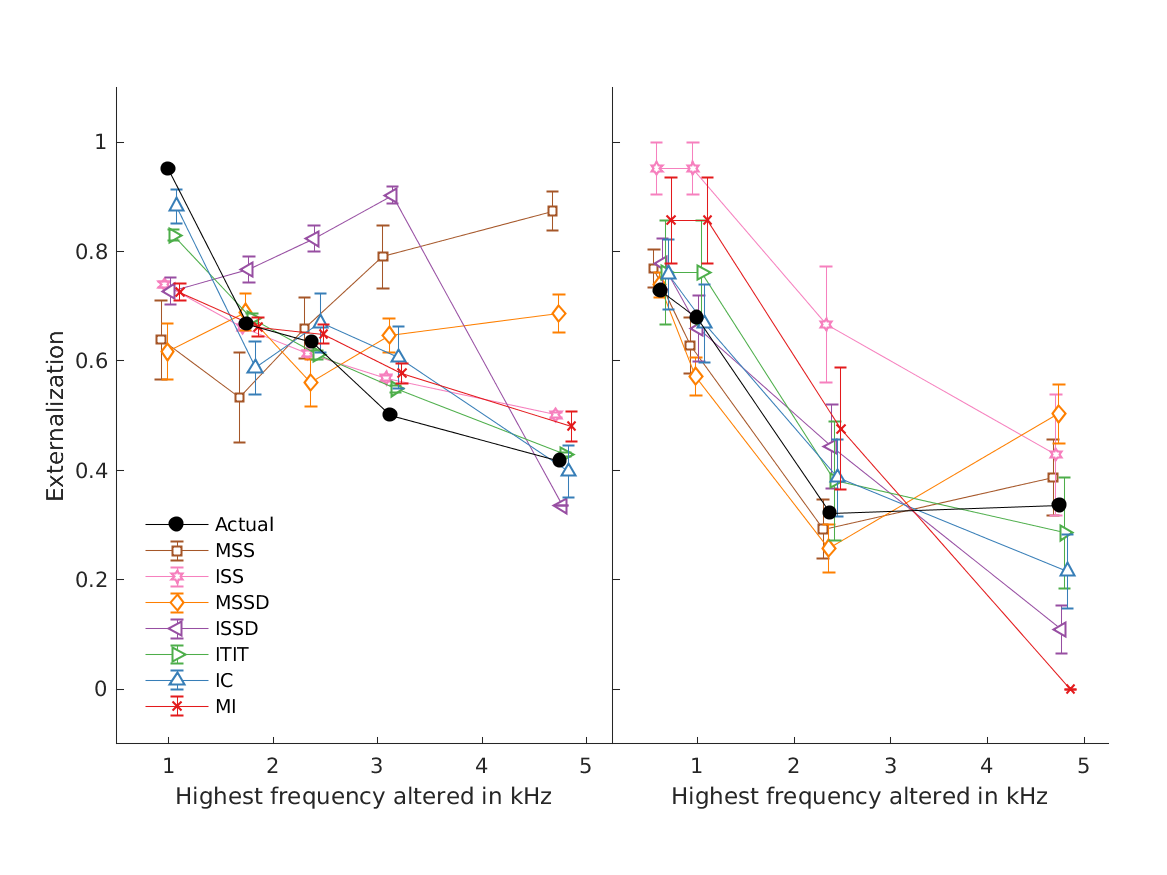
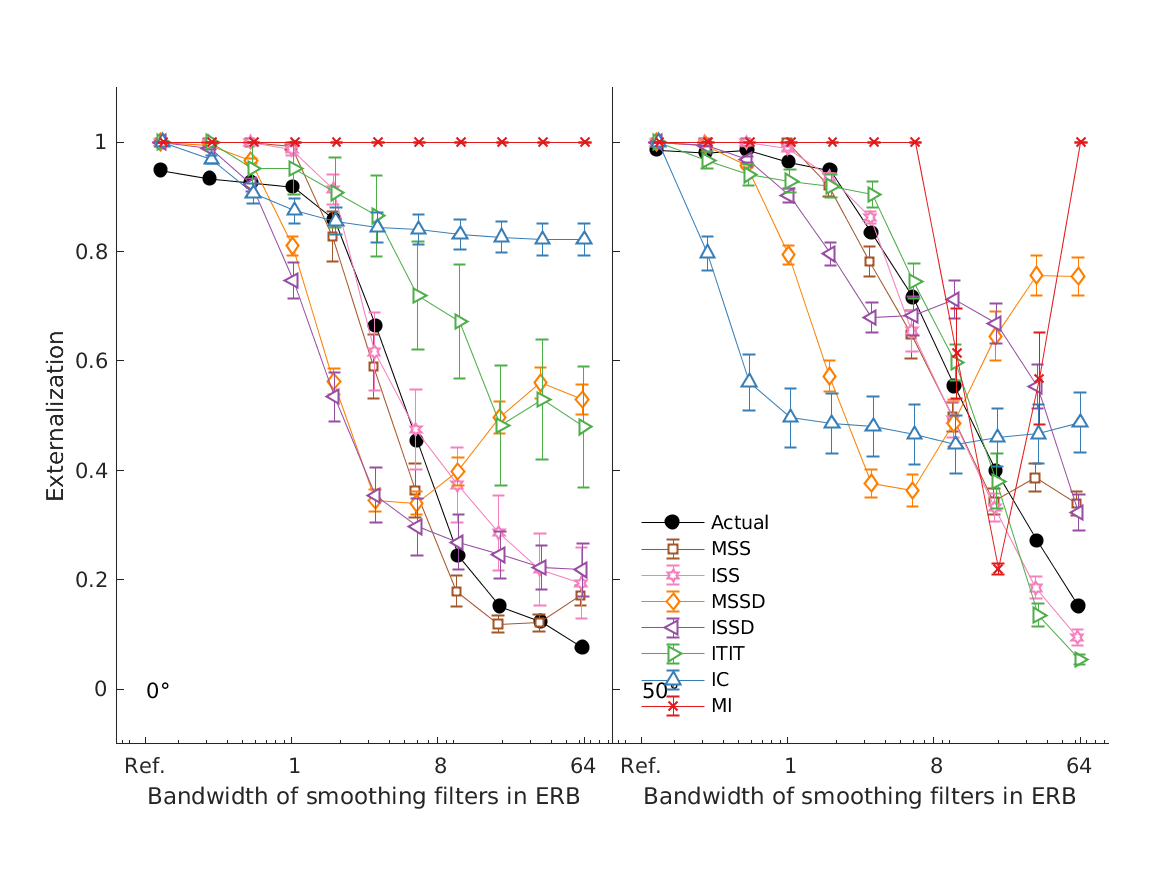
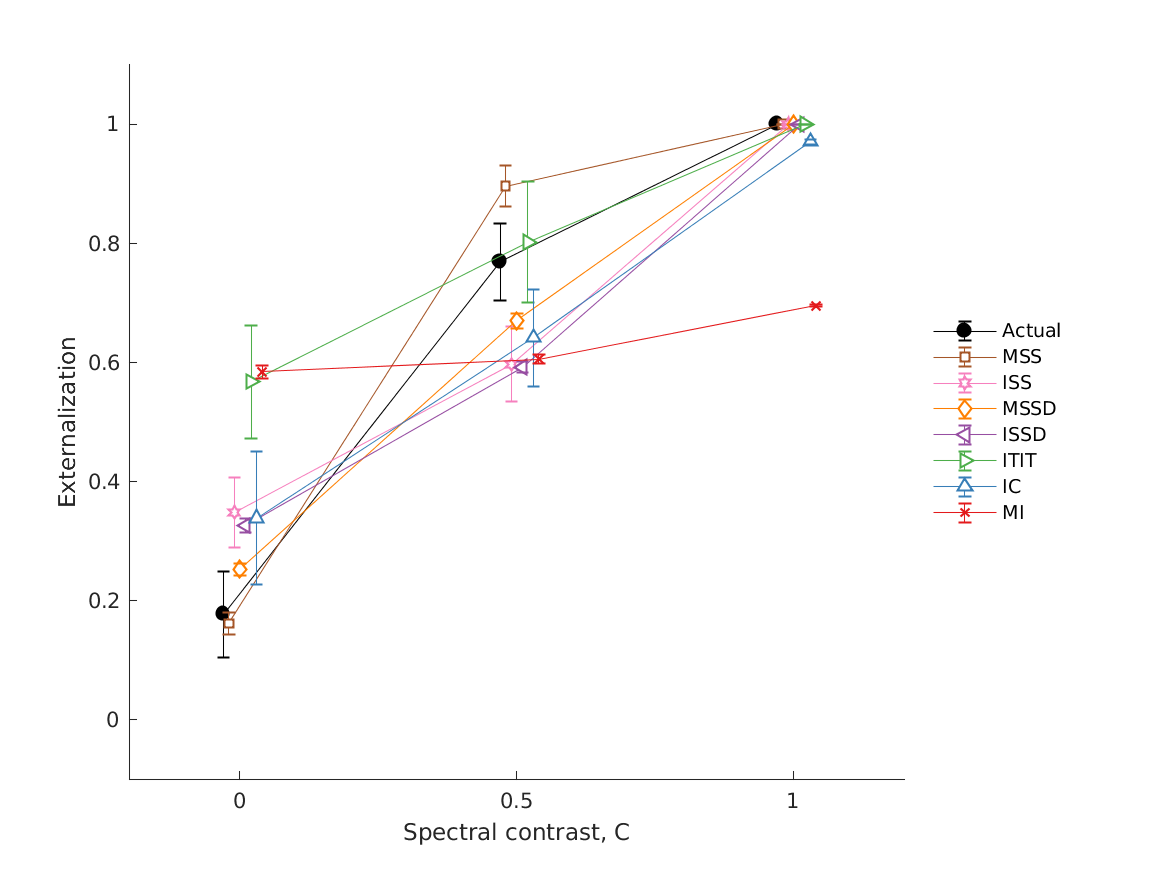
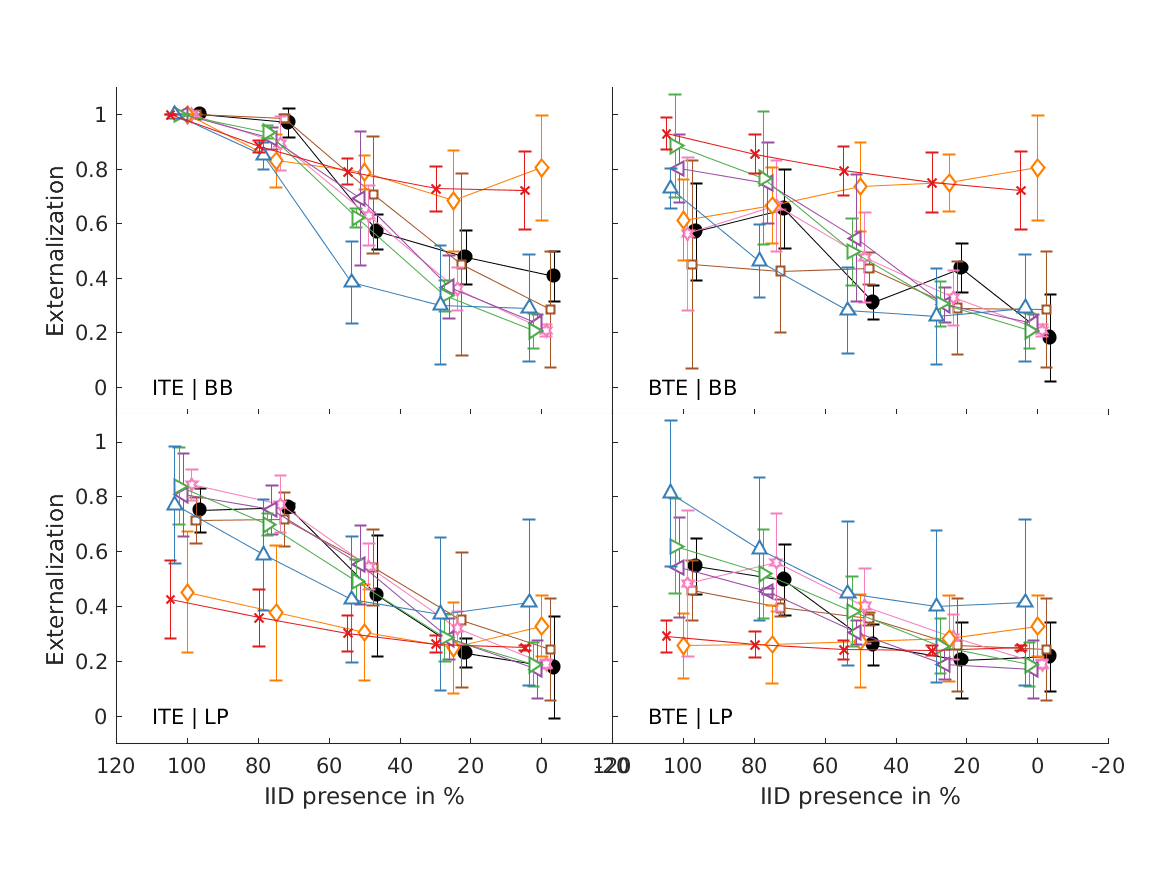
| 'fig2' | Externalization ratings: actual data from psychoacoustic experiments (closed circles) and simulations of the single-cue models (open symbols). Effects of low-frequency modifications tested by Hartmann and Wittenberg (1996). Exp. I: IID set to zero (bilateral average magnitude); actual data from their Fig.7, average from N=2. Exp. II: ipsilateral magnitudes flattened (IID compensated by contralateral magnitudes); actual data from their Fig.8, average from N=4. Simulated results for various cues, average from N=21. Exp.III: effect of spectral smoothing of low-frequency sounds presented from various azimuths (left: 0; right: 50); actual data represents direct-sound condition from Hassager et al. (2016), average from N=7. Simulated N=21. Exp.IV: effect of spectral smoothing in high frequencies as a function of spectral contrast (C=1: natural listener-specific spectral profile; C=0: flat spectra); actual data calculated from the paired-comparison data from Baumgartner et al. (2017), N=10 (actual and simulated). Exp.V: effects of stimulus bandwidth and microphone casing for various mixes between simulations based on listener-specific BRIRs (100%) and time-delay stereophony (0%); actual data from Boyd et al. (2012), N=3 (actual and simulated). ITE: in-the-ear casing; BTE: behind-the-ear casing; BB: broadband stimulus; LP: low-pass filtered at 6.5kHz; Error bars denote standard errors of the mean. Add flag supplements to also show the predictions for the different combination strategies. |
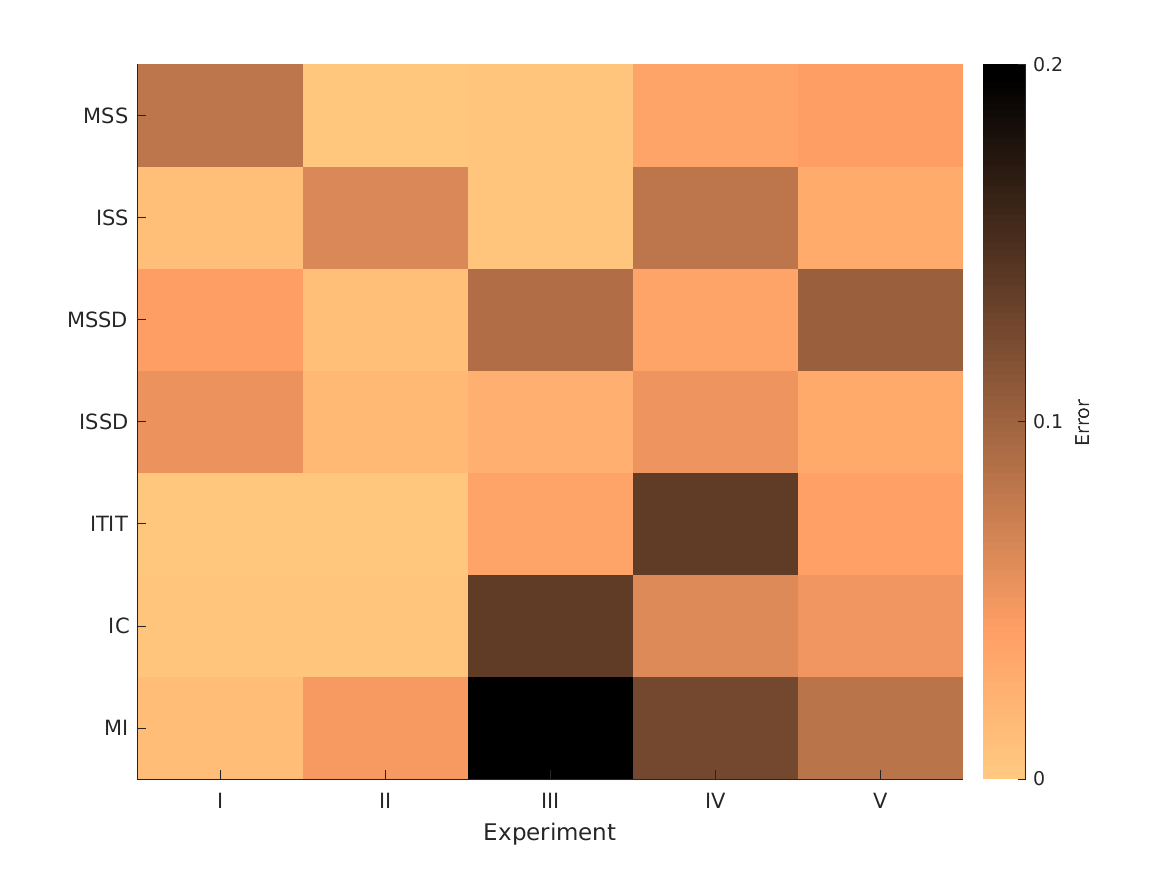
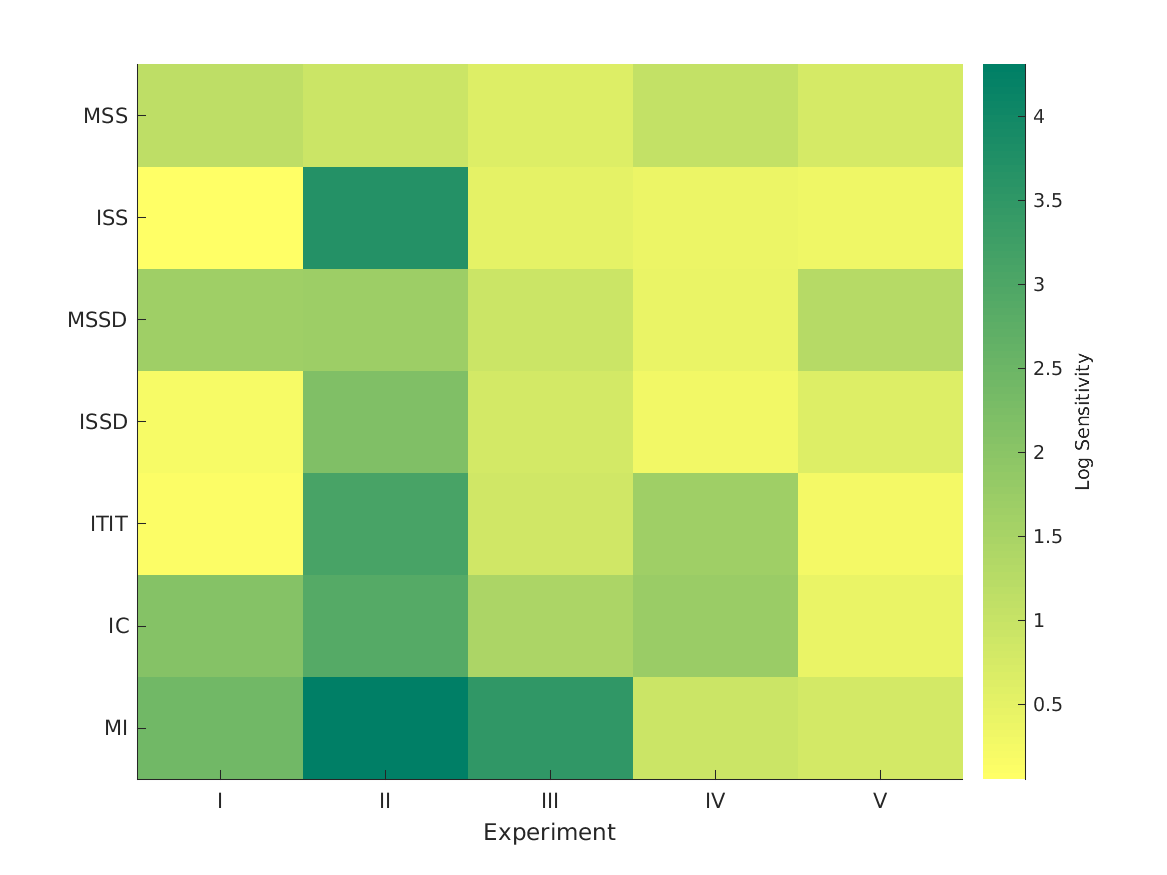
| 'fig3' | Optimization and performance of single-cue models. Cue-specific sensitivities used as optimization parameters. Higher values denote steeper mapping functions. Simulation errors as the RMS difference between the actual and simulated externalization ratings. Per experiment, the smallest error indicates the most informative cue. |
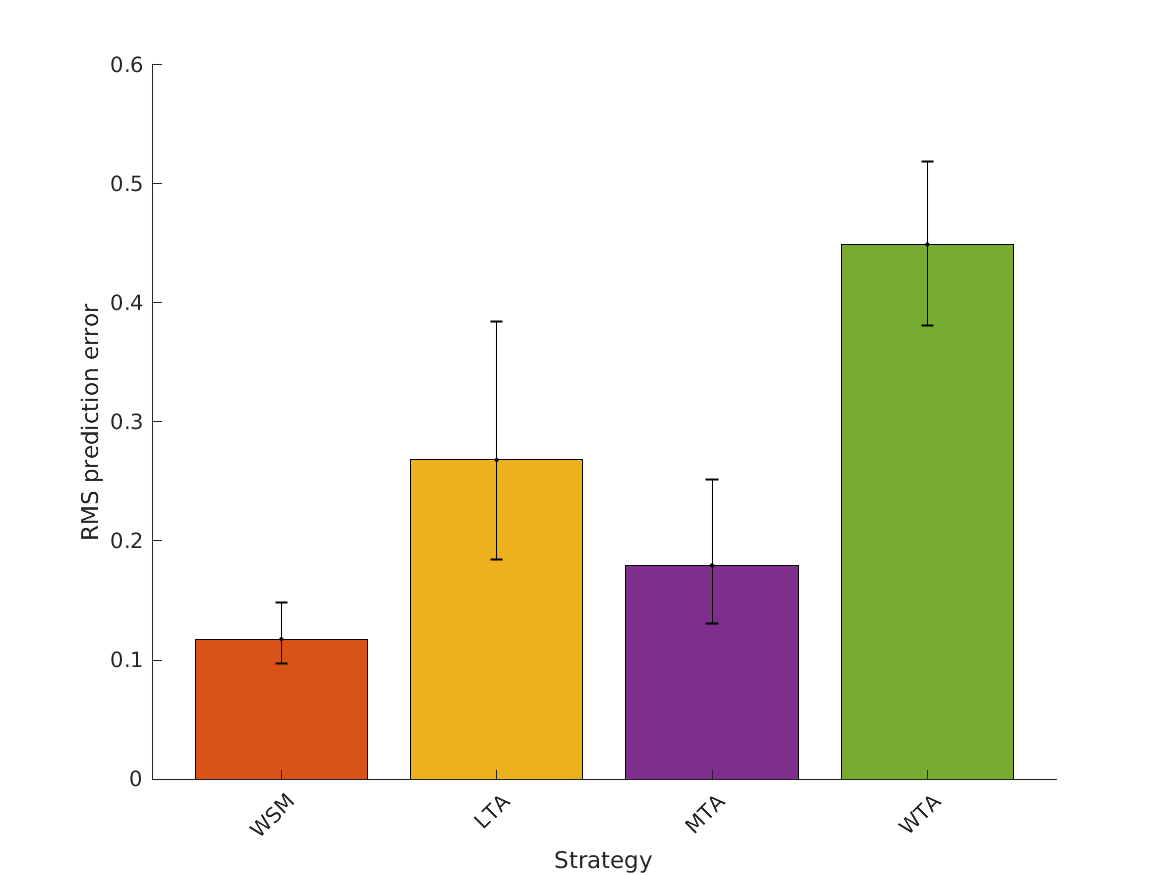
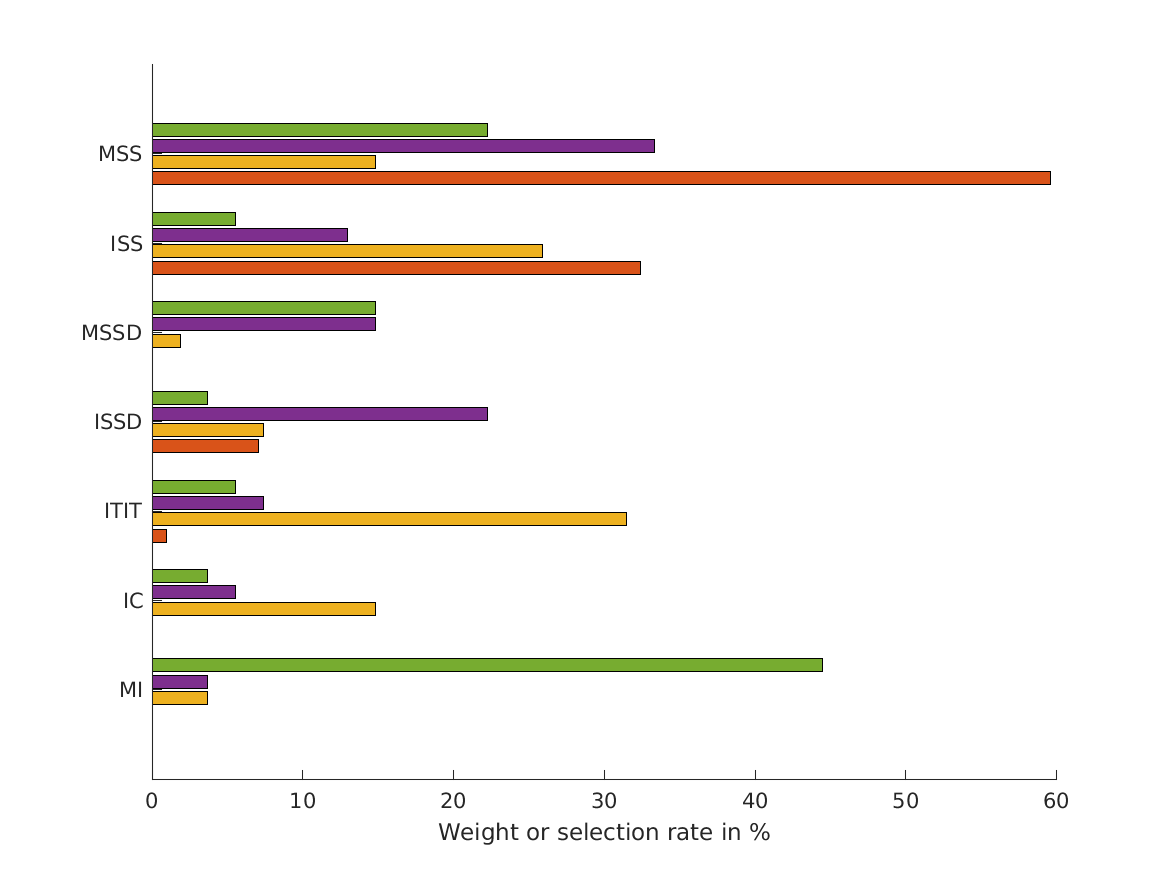
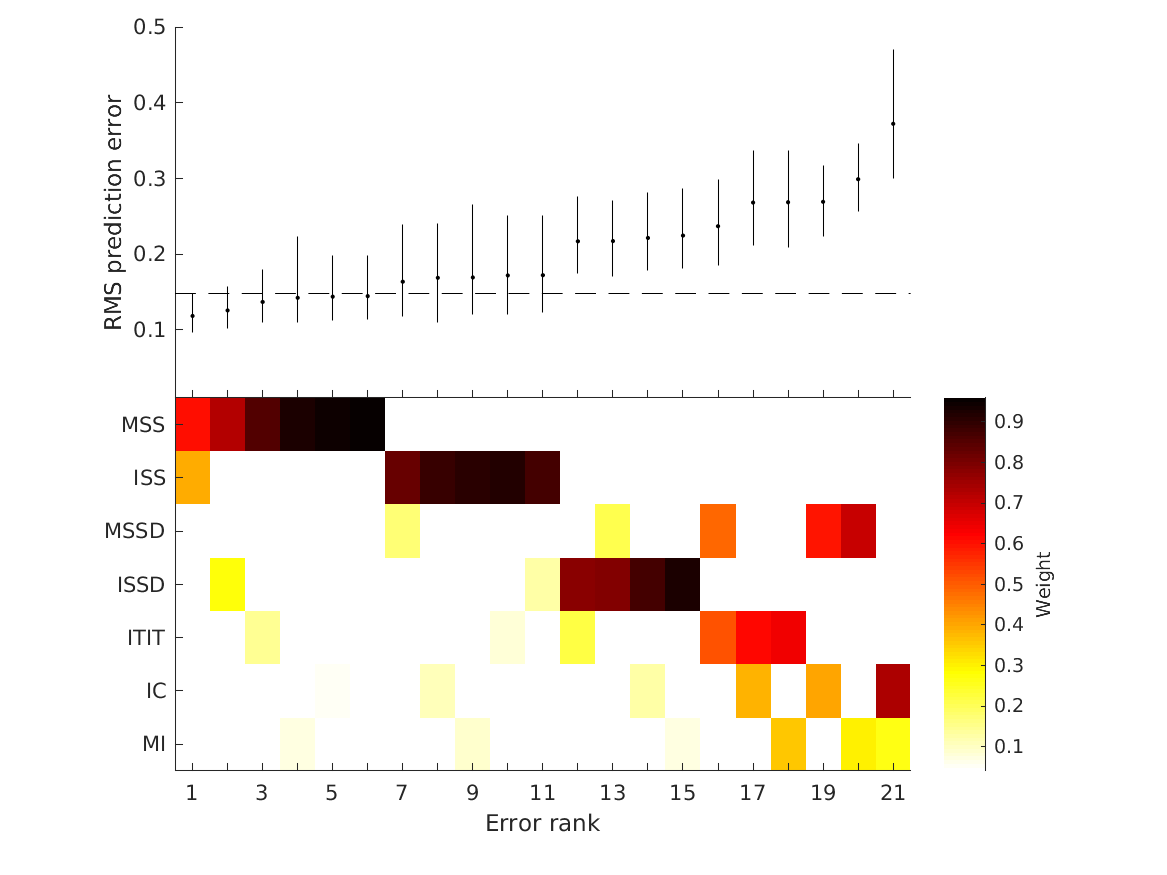
| 'fig4' | Simulation errors for different decision strategies and cue combinations show that static combination (WSM) based on monaural and interaural spectral shape cues (MSS, ISS) performs best. RMS simulation errors for different strategies and pooled experimental data, N=54. Error bars denote 95% confidence intervals estimated via bootstrapping (1000 resamples). WSM: weighted-sum model; L/M/WTA: looser/median/winner takes all. Individual cue contributions. Cue abbreviations defined in Tab.1. Top: Simulation errors for pairwise combinations of considered cues. Dashed line shows the border of significant difference to the best pair (MSS and ISS). Bottom: Considered cue pairs with their respective weights (encoded by brightness). Add flag supplements to also show the results for evaluations based on rank correlations. |
| 'hartmann1996' | models experiments from Hartmann & Wittenberg (1996; Fig.7-8) 1st panel: Synthesis of zero-ILD signals. Only the harmonics from 1 to nprime had zero interaural level difference; harmonics above nprime retained the amplitudes of the baseline synthesis. Externalization scores as a function of the boundary harmonic number nprime. Fundamental frequency of 125 Hz. 2nd panel: Synthesis of signals to test the ISLD hypothesis. Harmonics at and below the boundary retained only the interaural spectral level differences of the baseline synthesis. Higher harmonics retained left and right baseline harmonic levels. Externalization scores as a function of the boundary frequency. |
| 'hassager2016' | models experiments from Hassager et al. (2016; Fig.6). The mean of the seven listeners perceived sound source location (black) as a function of the bandwidth factor and the corresponding model predictions (colored). The model predictions have been shifted slightly to the right for a better visual interpretation. The error bars are one standard error of the mean. |
| 'baumgartner2017' | models experiments from Baumgartner et al. (2017). Effect of HRTF spectral contrast manipulations on sound externalization. Externalization scores were derived from paired comparisons via Bradley-Terry-Luce modeling. |
| 'boyd2012' | models experiments from Boyd et al. (2012; Fig.1, top). Average externalization ratings of 1 talker for NH participants against mix point as a function of microphone position (ITE/BTE) and frequency response (BB/LP). The reference condition (ref) is the same as ITE/BB. Error bars show SEM. |
Requirements:
- SOFA API v0.4.3 or higher from http://sourceforge.net/projects/sofacoustics for Matlab (in e.g. thirdparty/SOFA)
- Data in hrtf/baumgartner2017
- Statistics Toolbox for Matlab (for some of the figures)
Examples:
To display indivdual predictions for all experiments use
exp_baumgartner2021('fig2');
To display summary results for all experiments use
exp_baumgartner2021('fig3');
To display results for different decision strategies use
exp_baumgartner2021('fig4');
References:
R. Baumgartner, D. K. Reed, B. Tóth, V. Best, P. Majdak, H. S. Colburn, and B. Shinn-Cunningham. Asymmetries in behavioral and neural responses to spectral cues demonstrate the generality of auditory looming bias. Proceedings of the National Academy of Sciences, 2017. [ DOI | http ]
A. W. Boyd, W. M. Whitmer, J. J. Soraghan, and M. A. Akeroyd. Auditory externalization in hearing-impaired listeners: The effect of pinna cues and number of talkers. J. Acoust. Soc. Am., 131(3):EL268--EL274, 2012. [ DOI | www: ]
W. M. Hartmann and A. Wittenberg. On the externalization of sound images. J. Acoust. Soc. Am., 99(6):3678--88, June 1996.
H. G. Hassager, F. Gran, and T. Dau. The role of spectral detail in the binaural transfer function on perceived externalization in a reverberant environment. J. Acoust. Soc. Am., 139(5):2992--3000, 2016. [ www: ]


