THE AUDITORY MODELING TOOLBOX
This documentation page applies to an outdated AMT version (1.2.0). Click here for the most recent page.
EXP_REIJNIERS2014 - Experiments of Reijniers et al. (2014)
Usage
[] = exp_reijniers2014(flag)
Description
exp_reijniers2014(flag) reproduces figures of the study from Reijniers et al. (2014). Note that HRTFs from the ARI database are used for Fig. 4-6, which is most probably different to the HRTFs used for the calculations in the paper. For Fig. 2 and 3 HRTFs from the Symare database are used, which are also most probably non original.
The following flags can be specified
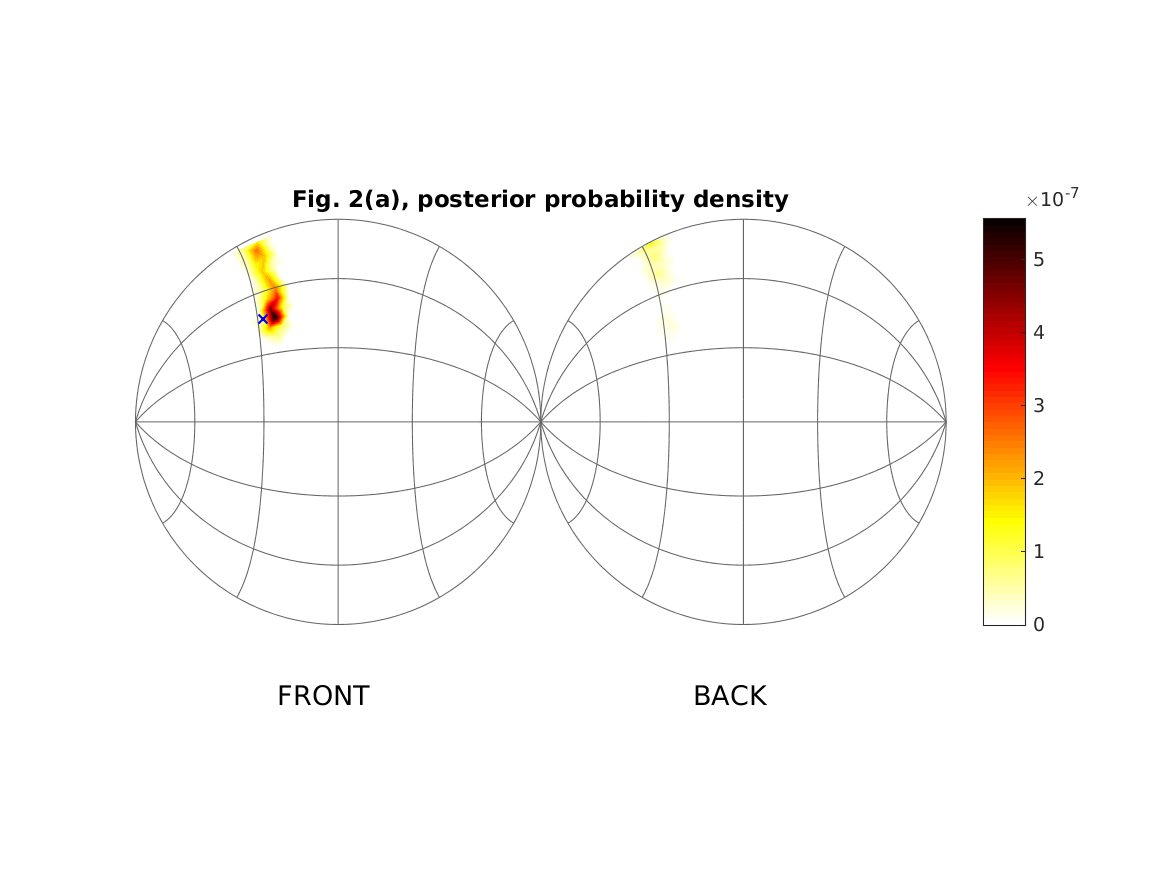
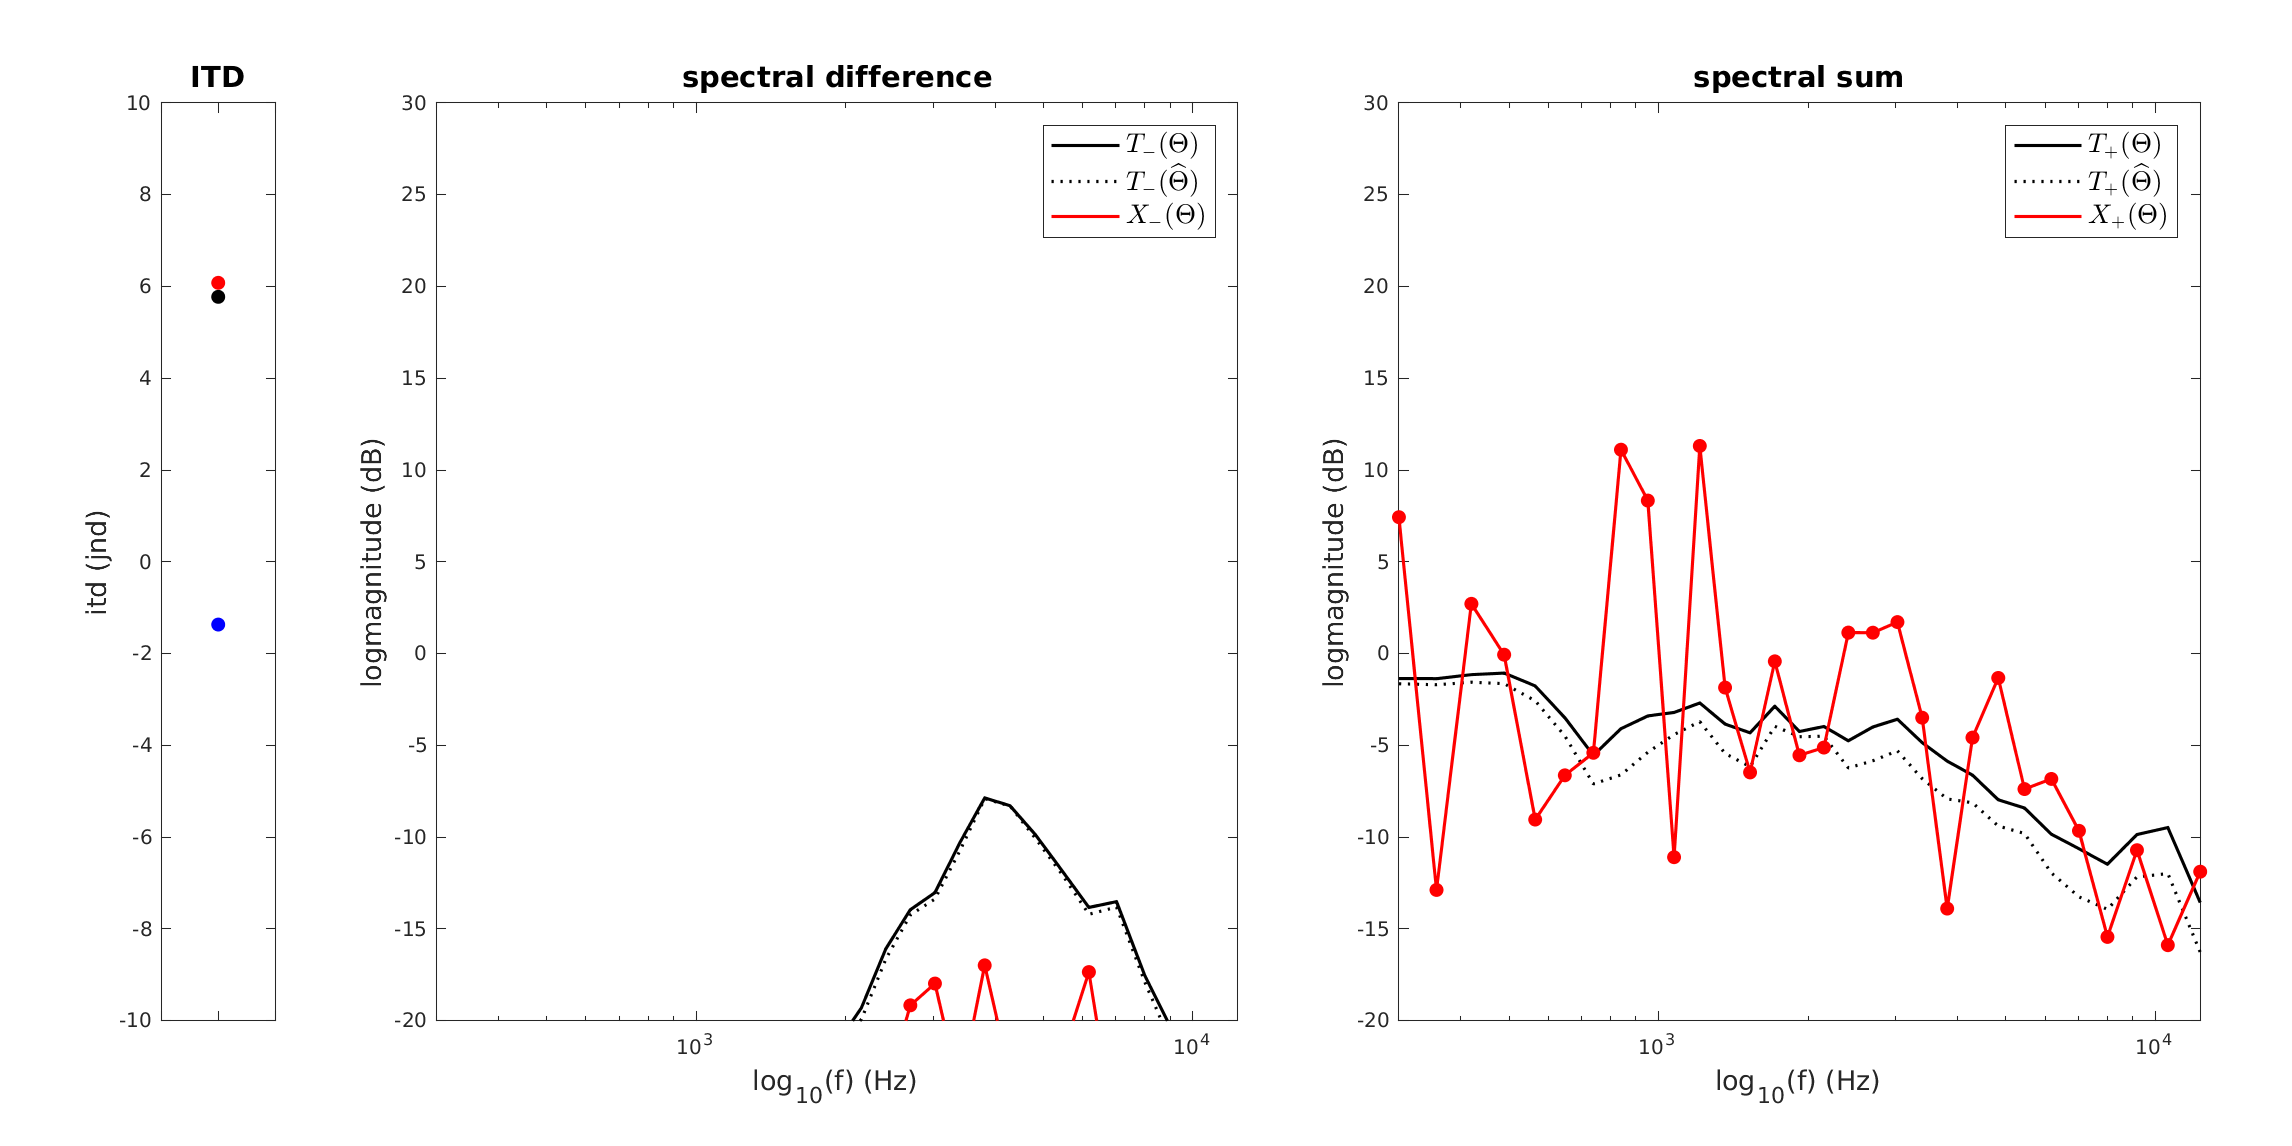
| 'fig2a' | Reproduce Fig. 2 (a): The results for simulated trial of a locali- zation experiment for subject 1 [see also Fig. 3(a)] in front Theta = (-34,45)deg (a) is shown. The figures show the simulated posterior angular probabilities and the templates corresponding to the original direction Theta (solid black line) and estimated direction Theta_est (dotted black line). The simulated auditory input is shown as the solid red line. |
| 'fig2b' | Reproduce Fig. 2 (b): The results for simulated trial of a locali- zation experiment for subject 1 [see also Fig. 3(a)] in back Theta = (14,171)deg (b) is shown. The figures show the simulated posterior angular probabilities and the templates corresponding to the original direction Theta (solid black line) and estimated direction Theta_est (dotted black line). The simulated auditory input is shown as the solid red line. |
| 'fig3' | Reproduce Fig. 3: The simulated mean spherical error as function of the source position for 3 different subjects. The average was taken over 500 localization trials for each source position. |
| 'fig4' | Reproduce Fig. 4(a): The mean localization performance when the simulation results are averaged over 100 subjects. Superimposed arrows indicate the size and direction of local population response biases for different source positions. |
| 'fig5' | Reproduce Fig. 5: Sensitivity analysis of the Bayesian localization model. The simulated mean spherical error is shown as function of the source position, when each of the model parameters is varied separately. The average was taken over 500 localization trials for each source position and 100 subjects were pooled. (a) The model with input parameters as described in the main text. The standard deviation is doubled, respectively for (b) the noise on the ITD, (c) the internal noise and the variation on (d) the source spectrum. In (e), the bandwidth of the source is reduced to [300Hz-8kHz]. |
| 'fig6' | Reproduce Fig. 6: The mean spherical error for different values of the SNR. SNR=75dB corresponds to the control situation, see Fig.5(a), as the magnitude in all frequency channels is above the system noise level. |
| 'tab1_barumerli2020aes' | |
| Reproduce Tab. 1: Comparison between actual (majdak2010) and simulated, performances by relying on different perceptual metrics (middlebrooks1999b). The variable 'multiplier' allows to tune the internal noise. | |
| 'fig2_barumerli2020forum' | |
| Reproduce Fig.2 of Barumerli et al. (2020): comparison between virtual estimations and real data (see data_middlebrooks1999()) for individual and non-individual DTFs | |
| 'fig3_barumerli2020forum' | |
| Reproduce Fig.3 of Barumerli et al. (2020): estimations' evaluation with band limited spectra. See Best et al. 2005 and Fig 11 baumgartner2014 | |
| 'fig4_barumerli2020forum' | |
| Reproduce Fig.4 of Barumerli et al. (2020): estimations' evaluation with rippled spectra. See Macpherson and Middlebrooks 2003 and Fig 10 baumgartner2014 | |
Further, cache flags (see amt_cache) and plot flags can be specified (Warning: Enforcing recalculation of cached data might take several hours). 'no_plot Do not compute plots. Flag for cluster execution.'
| 'interp' | Plot scattered interpolated data (default). |
| 'scatter' | Plot only discrete scattered data instead of inter- polated scattered data. |
| 'redo_fast' | Quickly recalculate data for figures without using cache. To speed up computation the amount of locali- zation trials for Fig. 3 is reduced to 20 and the amount of subjects for Fig. 4-6 is reduced to 12. |
Requirements:
- SOFA API v1.1 or higher from http://sourceforge.net/projects/sofacoustics for Matlab (e.g. in thirdparty/SOFA)
Examples:
To display right part of Fig. 2 (a) use
exp_reijniers2014('fig2a');
To display Fig. 3 and do a quick recalcultaion use
exp_reijniers2014('fig3','redo_fast');
References:
R. Barumerli, P. Majdak, R. Baumgartner, J. Reijniers, M. Geronazzo, and F. Avanzini. Predicting directional sound-localization of human listeners in both horizontal and vertical dimensions. In Audio Engineering Society Convention 148. Audio Engineering Society, 2020.
R. Barumerli, P. Majdak, R. Baumgartner, M. Geronazzo, and F. Avanzini. Evaluation of a human sound localization model based on bayesian inference. In Forum Acusticum, 2020.
J. Reijniers, D. Vanderleist, C. Jin, C. S., and H. Peremans. An ideal-observer model of human sound localization. Biological Cybernetics, 108:169--181, 2014.


Build with Bootstrap