THE AUDITORY MODELING TOOLBOX
This documentation page applies to an outdated AMT version (1.2.0). Click here for the most recent page.
EXP_ZIEGELWANGER2013 - Figures from Ziegelwanger and Majdak (2013)
Usage
data = exp_ziegelwanger2013(flag)
Description
exp_ziegelwanger2013(flags) reproduces figures of the paper from Ziegelwanger and Majdak (2013).
Optional fields of output data structure:
The following flags can be specified:
| 'plot' | Plot the output of the experiment. This is the default. |
| 'no_plot' | Don't plot, print results in the console. |
| 'cached' | Reload previously calculated results. This is the default. |
| 'redo' | Recalculate results. |
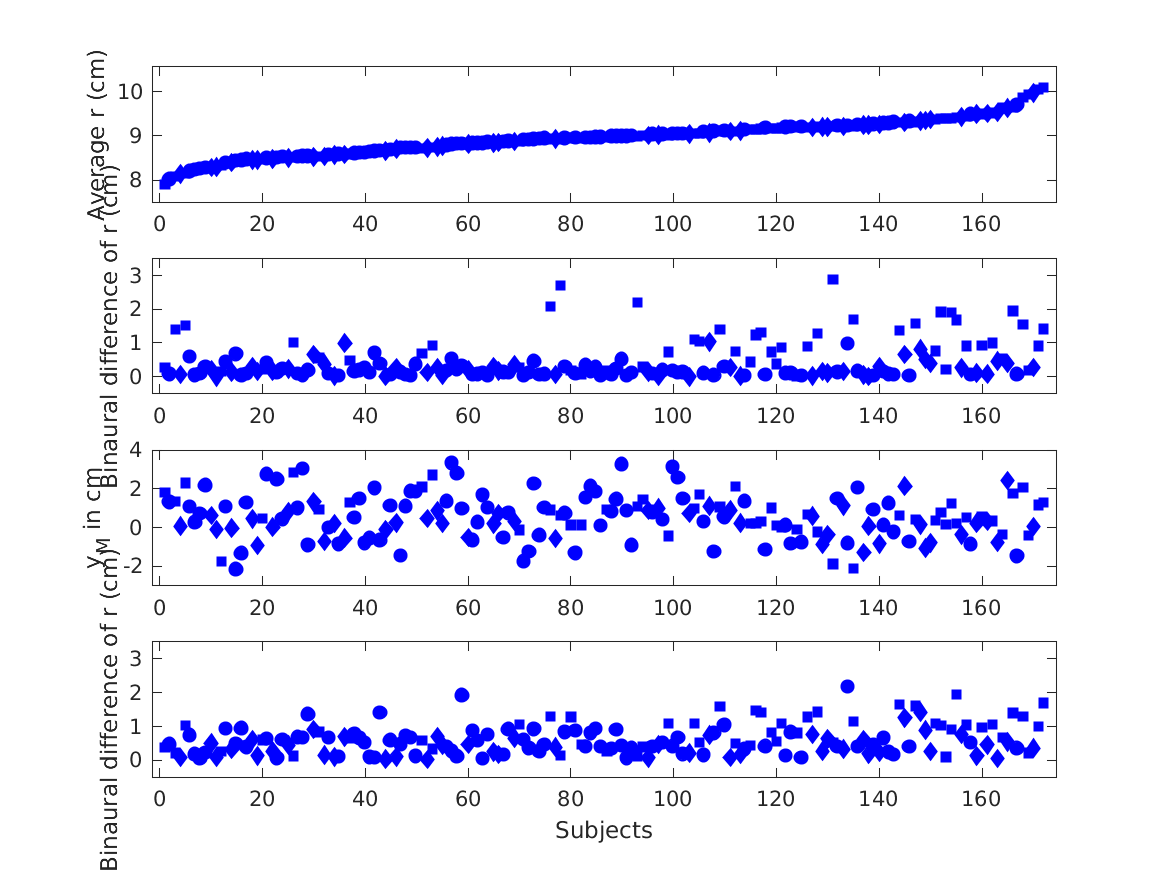
| 'fig1a' | Reproduce Fig. 1 from ziegelwanger2013: Model parameters (sphere radius, sphere center) resulting from fitting the off-axis model to HRTFs of human listeners. |
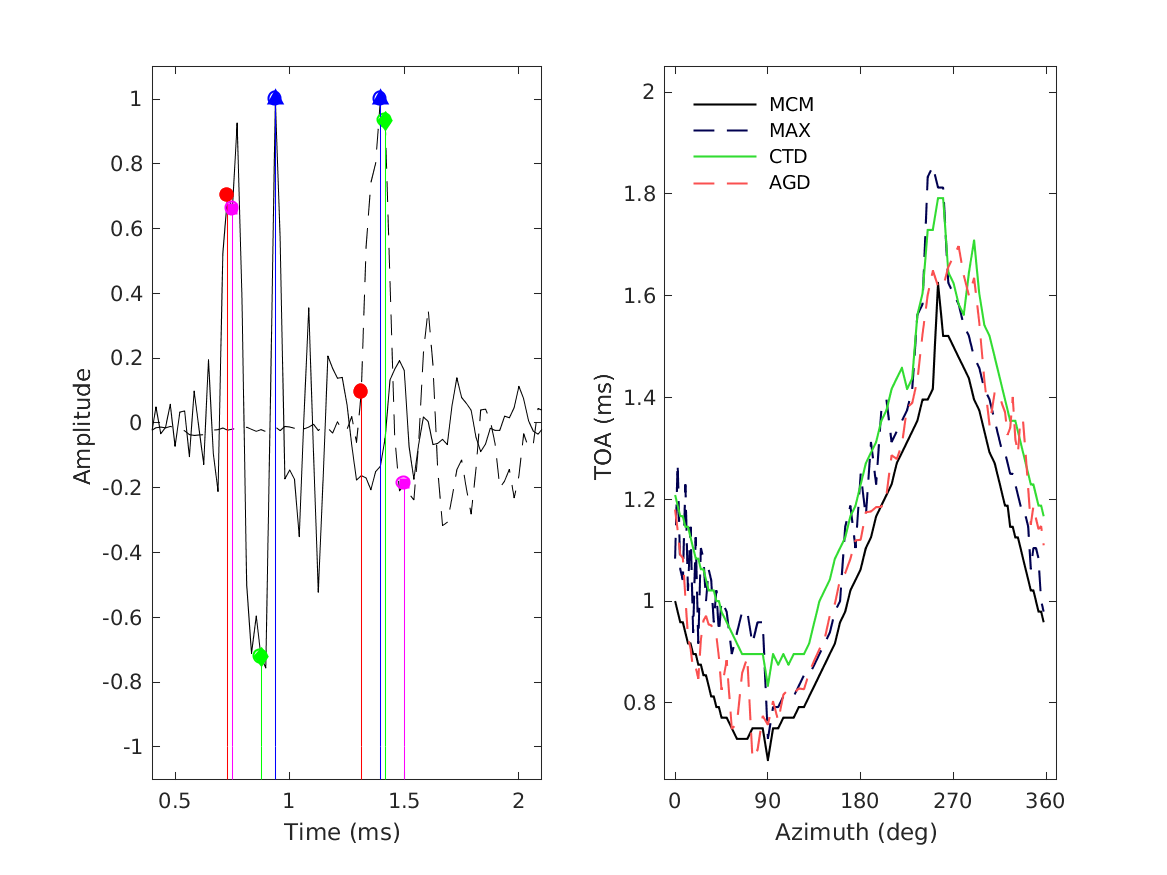
| 'fig1b' | Reproduce Fig. 1 from majdak2013: Left panel: Normalized HRIRs of NH89 (ARI database). Sound source was placed 45 deg left in the horizontal plane. Solid line: for the left ear Dashed line: for the right ear Vertical lines: Estimated TOAs Arrows: Resulting ITDs from the corresponding TOAs Circles, Red: Minimum-Phase Cross-Correlation Method Triangle, Green: Time-Position of the HRIR-Maximum Diamonds, Blue: Centroid of the HRIR Squares, Magenta: Average Group Delay (1-5 kHz) Right panel: Estimated TOAs of NH89 (ARI database) in the horizontal interaural plane. Black: Minimum-Phase Cross-Correlation Method Blue: Time-Position of the HRIR-Maximum Green: Centroid of the HRIR Red: Average Group Delay (1-5 kHz) |
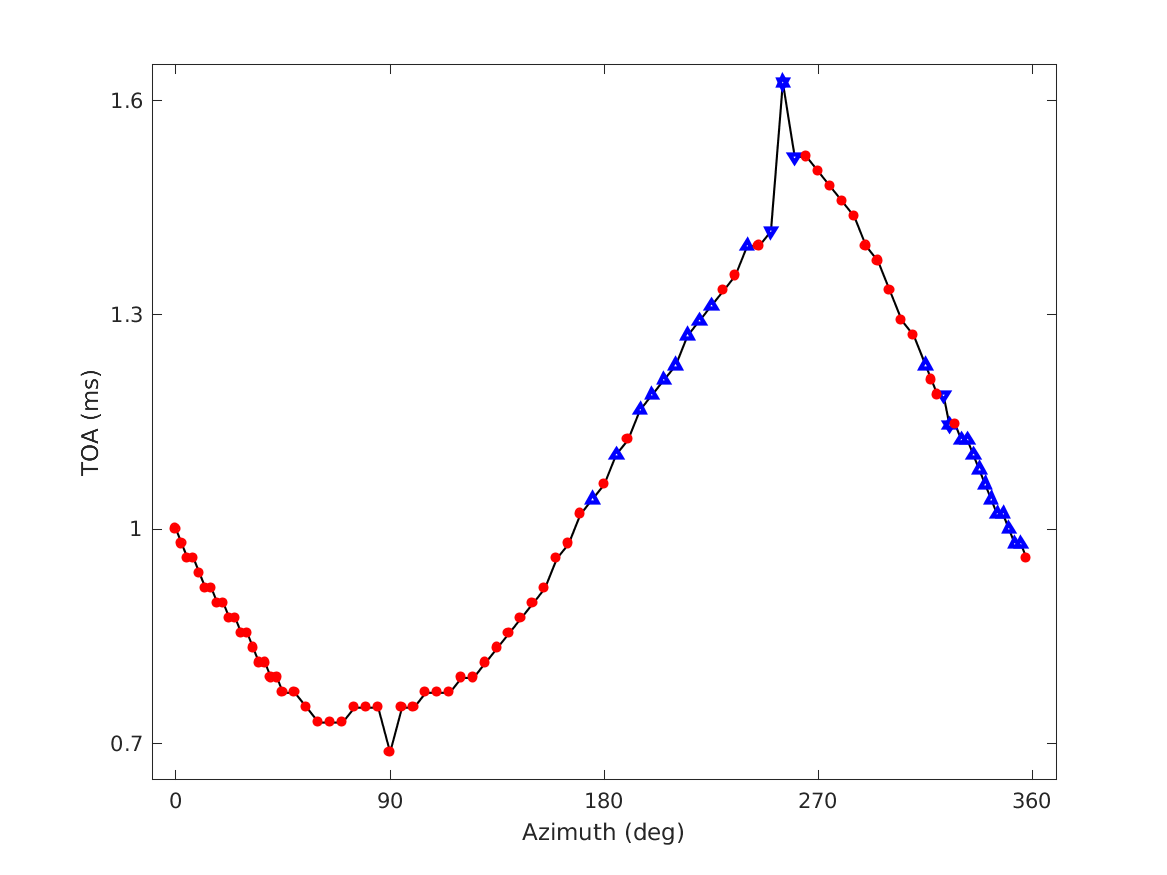
| 'fig2b' | Reproduce Fig. 2 from majdak2013: Right panel: Estimated TOAs, detected outliers and outlier adjusted set of TOAs for NH89 (ARI database) in the horizontal plane. Line: Estimated TOAs Triangles (down), Blue: Detected outliers for the azimuthal slope criterion Triangles (up), Blue: Detected outliers for the sagittal variance criterion Dots, Red: Outlier-adjusted set |
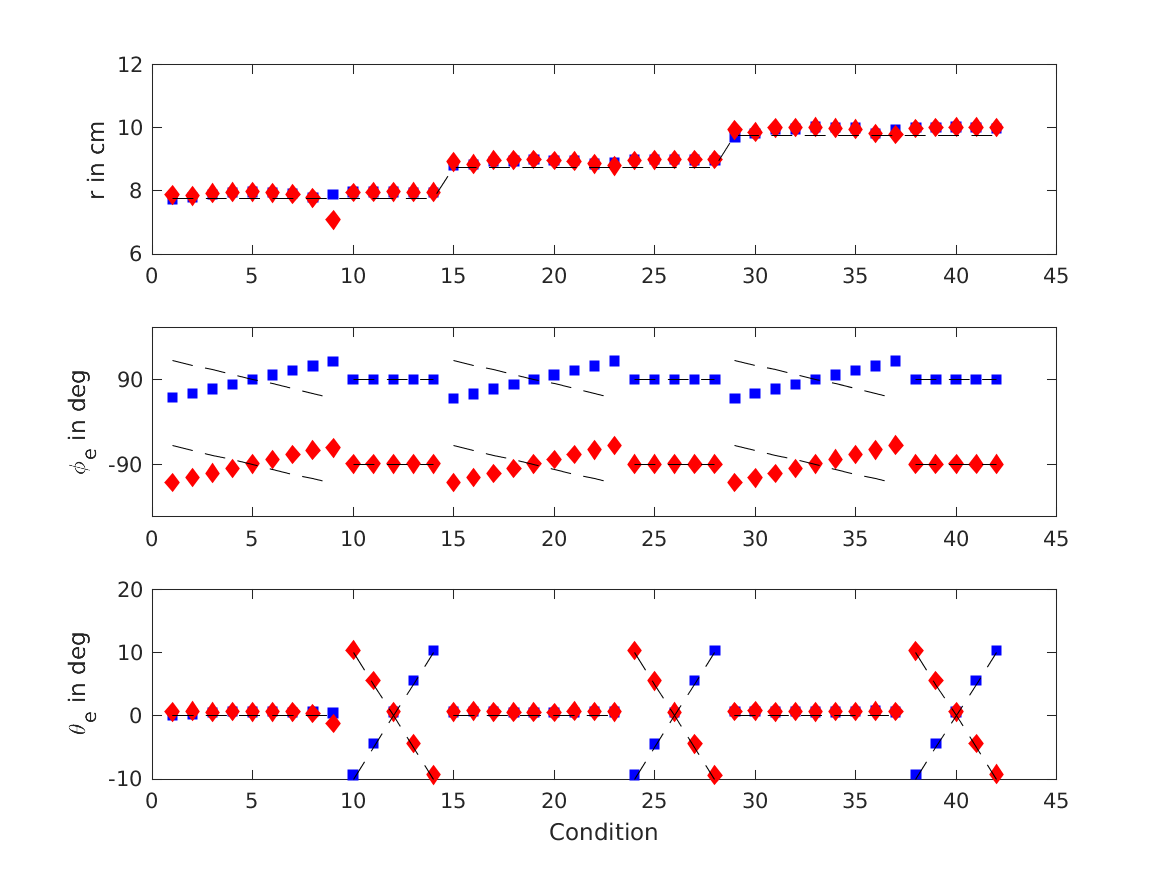
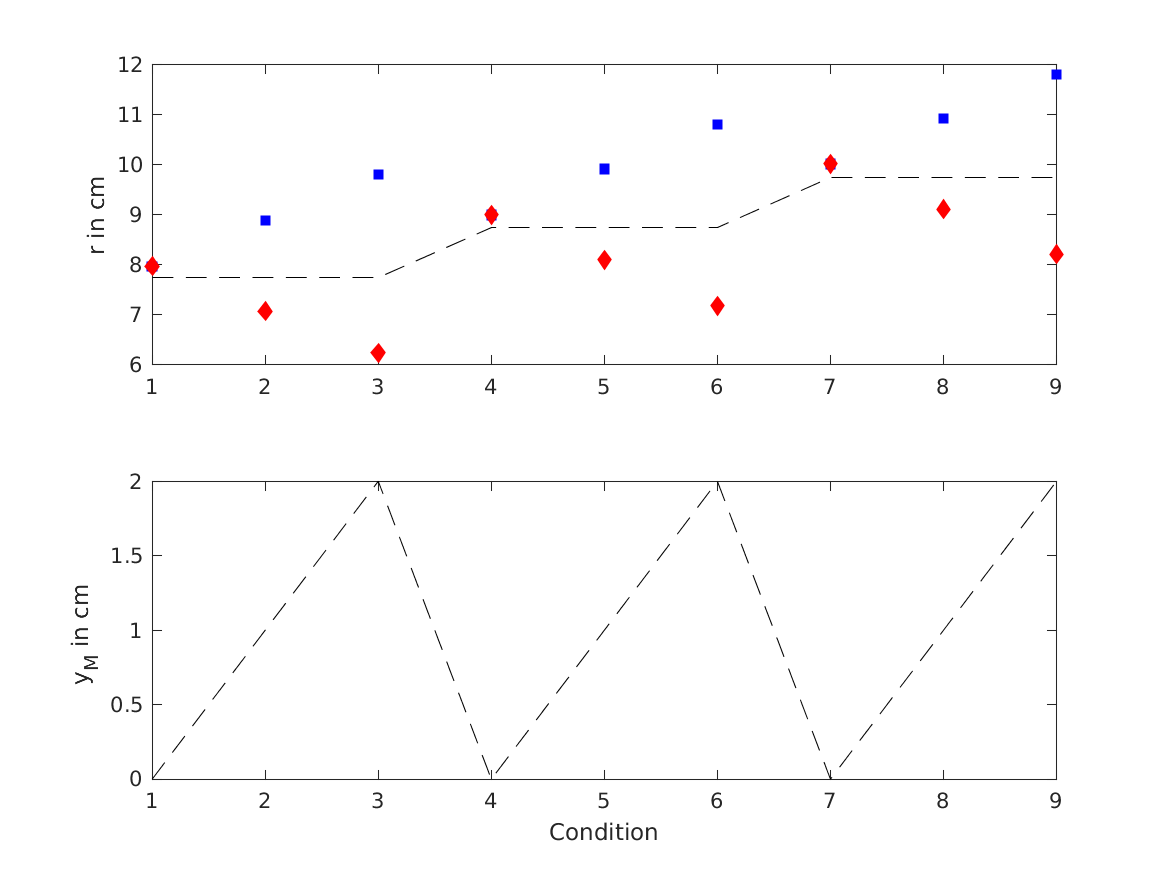
| 'fig3b' | Reproduce Fig. 3 from majdak2013: Left panel: Model parameters (sphere radius, ear position) resulting from fitting the on-axis model to HRTFs of a rigid sphere. Squares: for the left ear Diamonds: for the right ear Dashed lines: set values used in the numerical HRTF calculation Right panel: Model parameters (sphere radius) resulting from fitting the on-axis model to HRTFs of an off-axis placed rigid sphere. |
Requirements:
- SOFA API from http://sourceforge.net/projects/sofacoustics for Matlab (in e.g. thirdparty/SOFA)
- Optimization Toolbox for Matlab
- Data in hrtf/ziegelwanger2013
Examples:
To display Fig. 1a, use
exp_ziegelwanger2013('fig1a');
To display Fig. 1b, use
exp_ziegelwanger2013('fig1b');
This code produces the following output:
MAX: ITD is 0.4375 ms
CTD: ITD is 0.52083 ms
AGD: ITD is 0.72917 ms
MCM: ITD is 0.5625 ms
To display Fig. 2b, use
exp_ziegelwanger2013('fig2b');
To display Fig. 3b, use
exp_ziegelwanger2013('fig3b');
References:
P. Majdak and H. Ziegelwanger. Continuous-direction model of the broadband time-of-arrival in the head-related transfer functions. In ICA 2013 Montreal, volume 19, page 050016, Montreal, Canada, 2013. ASA. [ DOI ]
H. Ziegelwanger and P. Majdak. Modeling the broadband time-of-arrival of the head-related transfer functions for binaural audio. In Proceedings of the 134th Convention of the Audio Engineering Society, page 7, Rome, 2013.


Build with Bootstrap