THE AUDITORY MODELING TOOLBOX
This documentation page applies to an outdated AMT version (1.0.0). Click here for the most recent page.
EXP_BAUMGARTNER2021 - - Simulations of Baumgartner and Majdak (2021)
Usage
data = exp_baumgartner2021(flag)
Description
exp_baumgartner2021(flag) reproduces figures of the study from Baumgartner and Majdak (2021).
The following flags can be specified
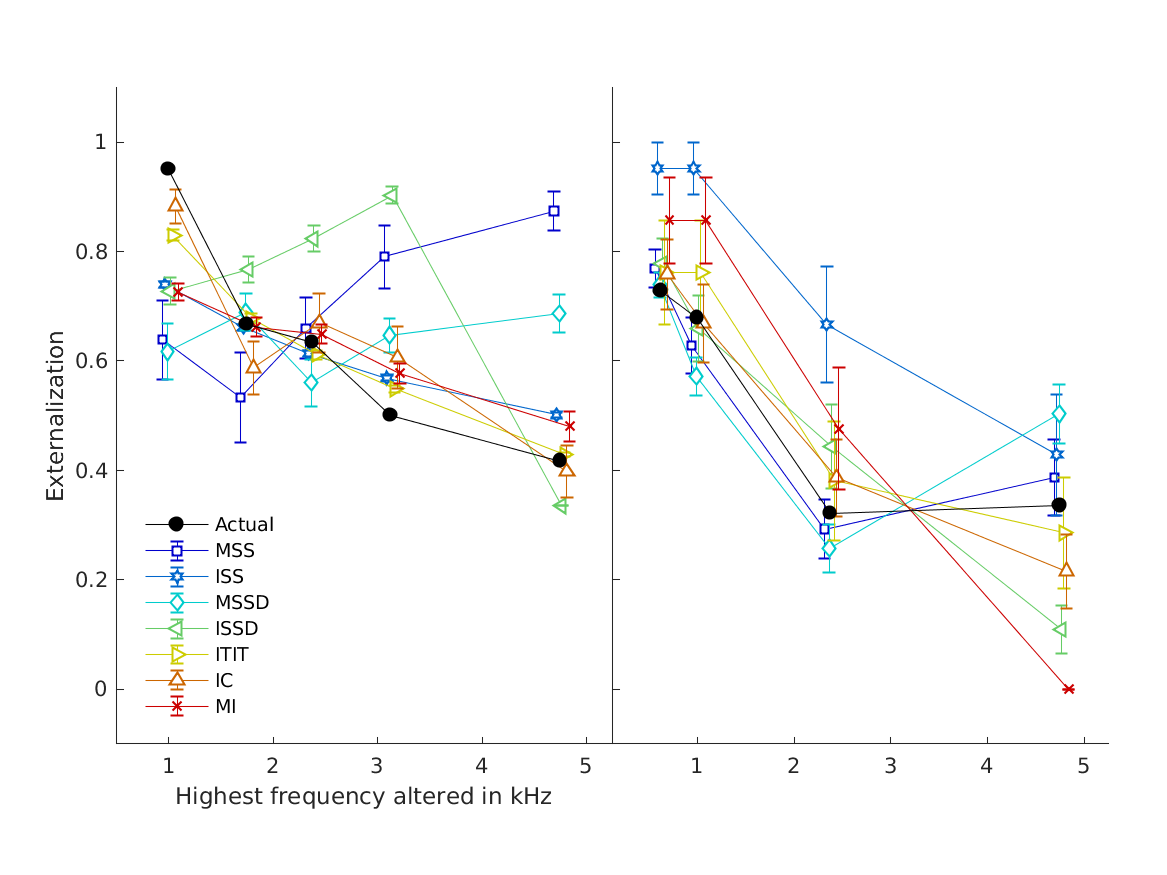
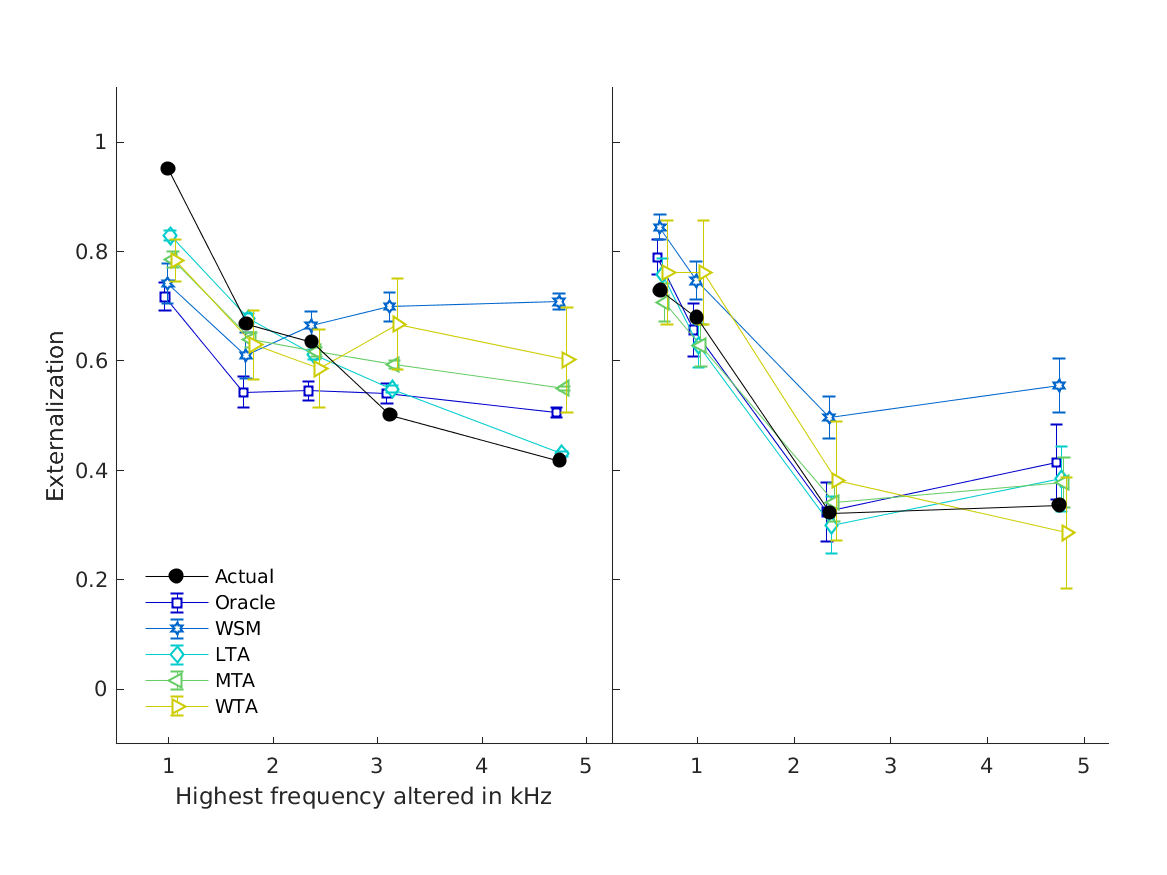
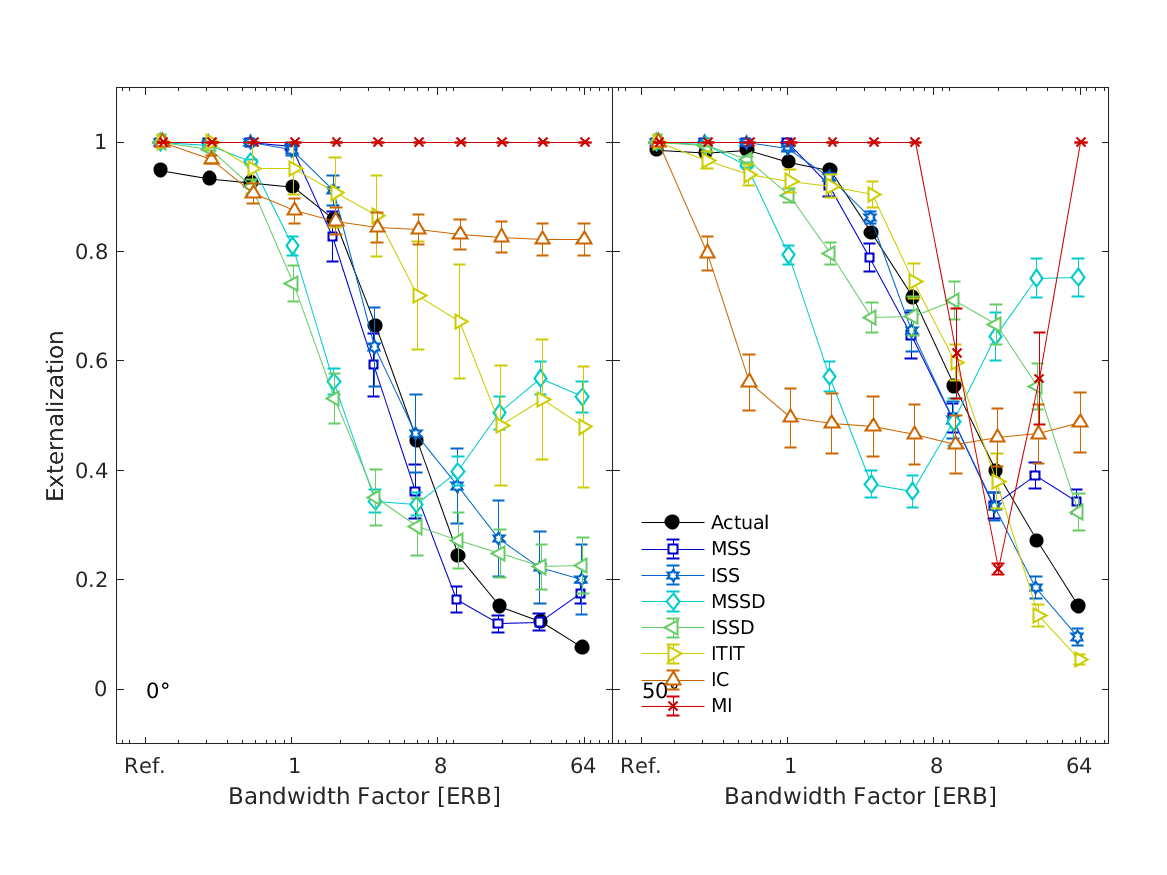
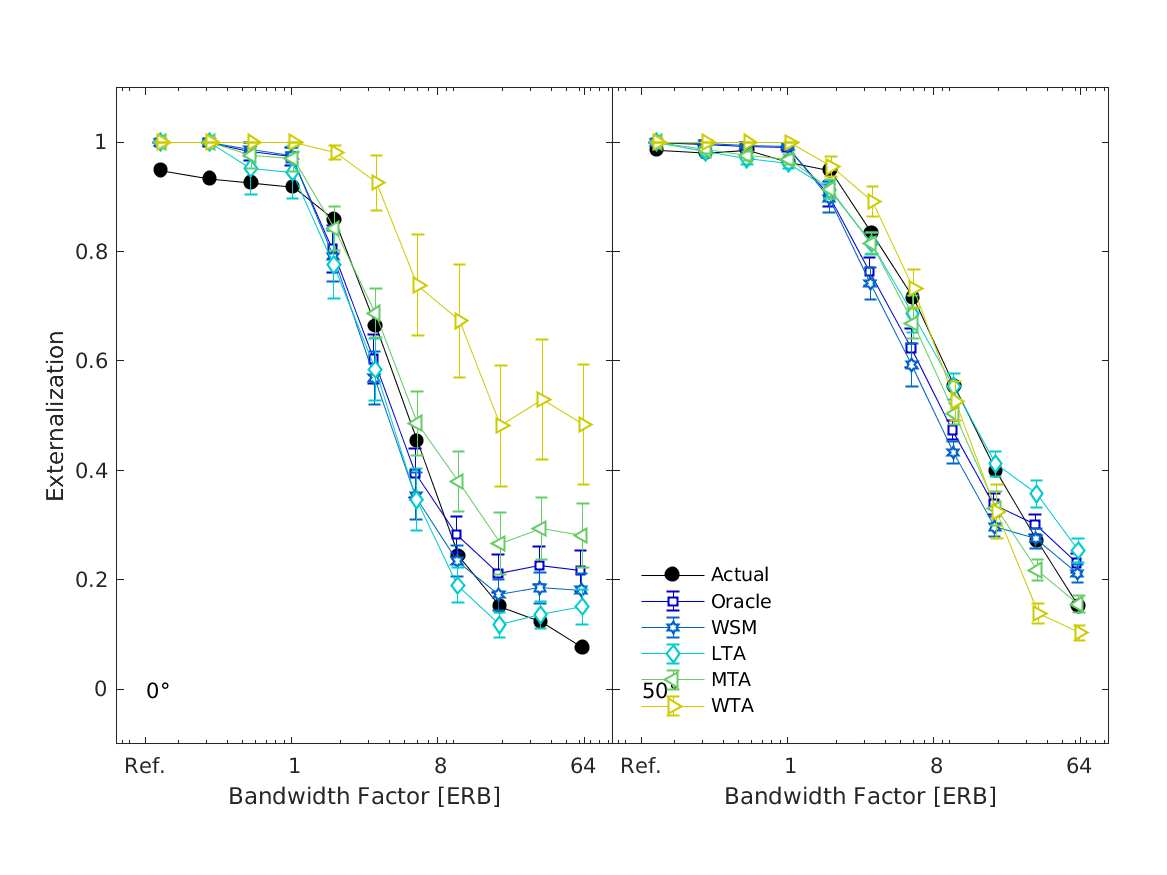
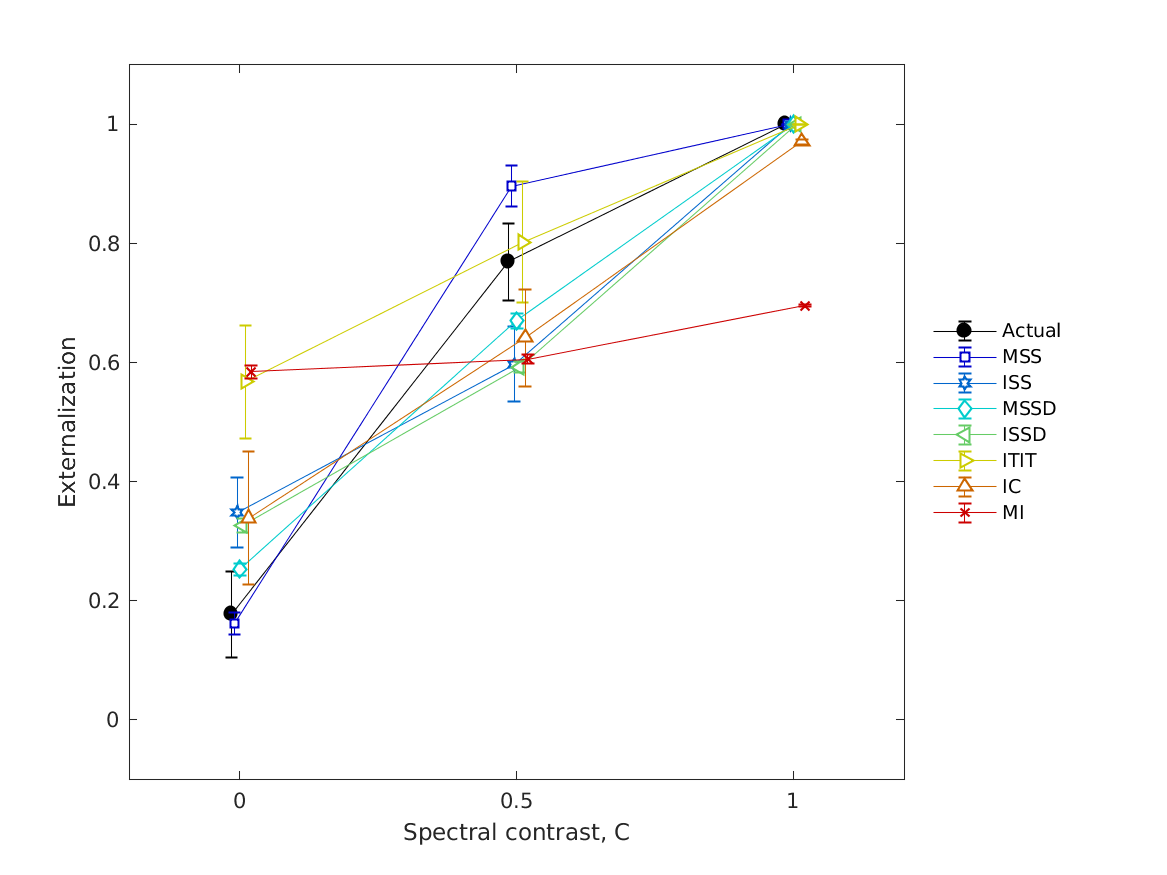
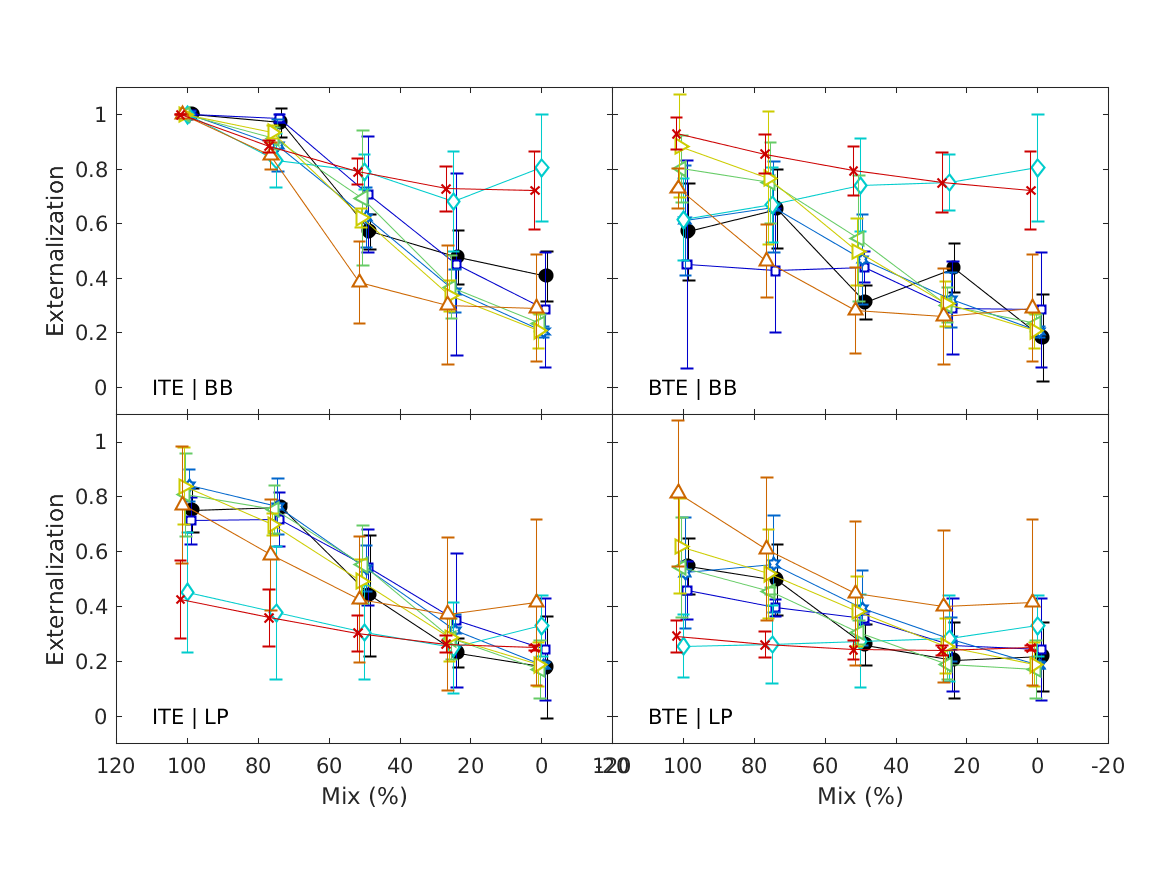
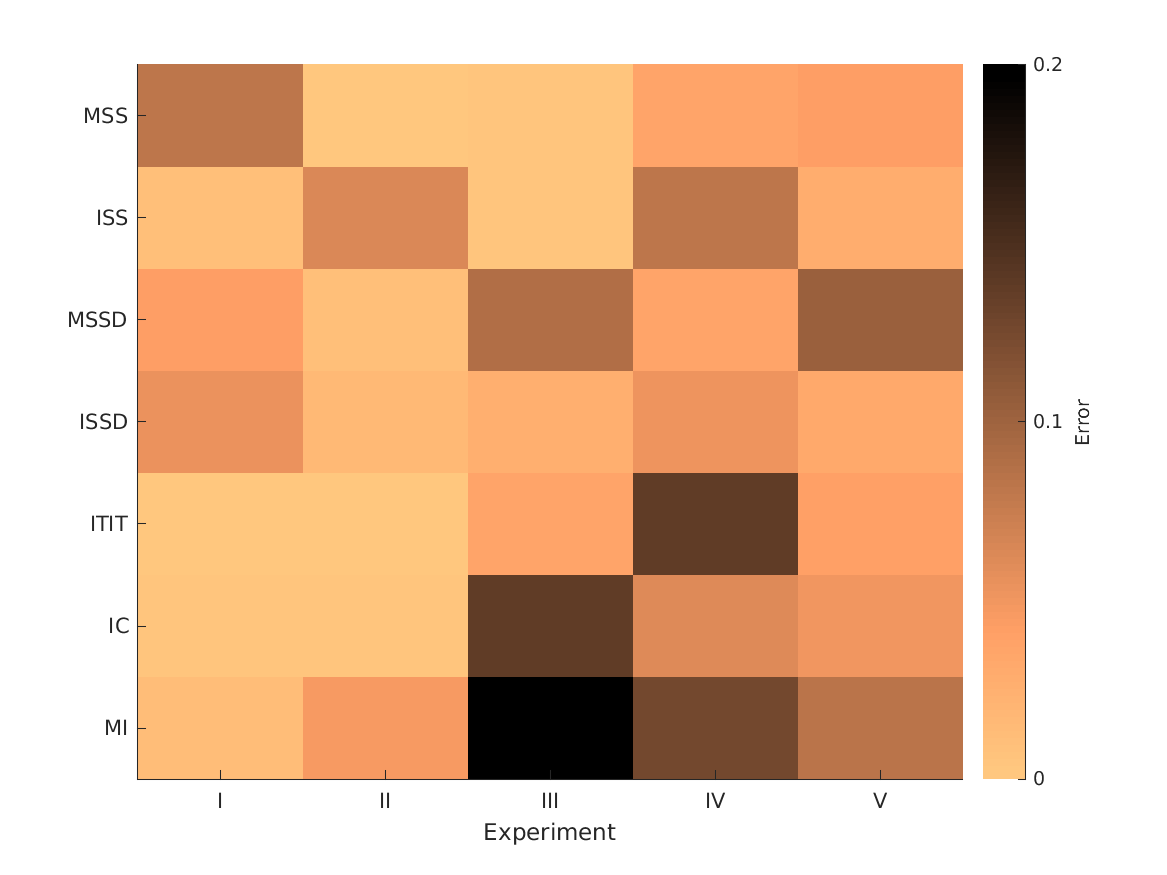
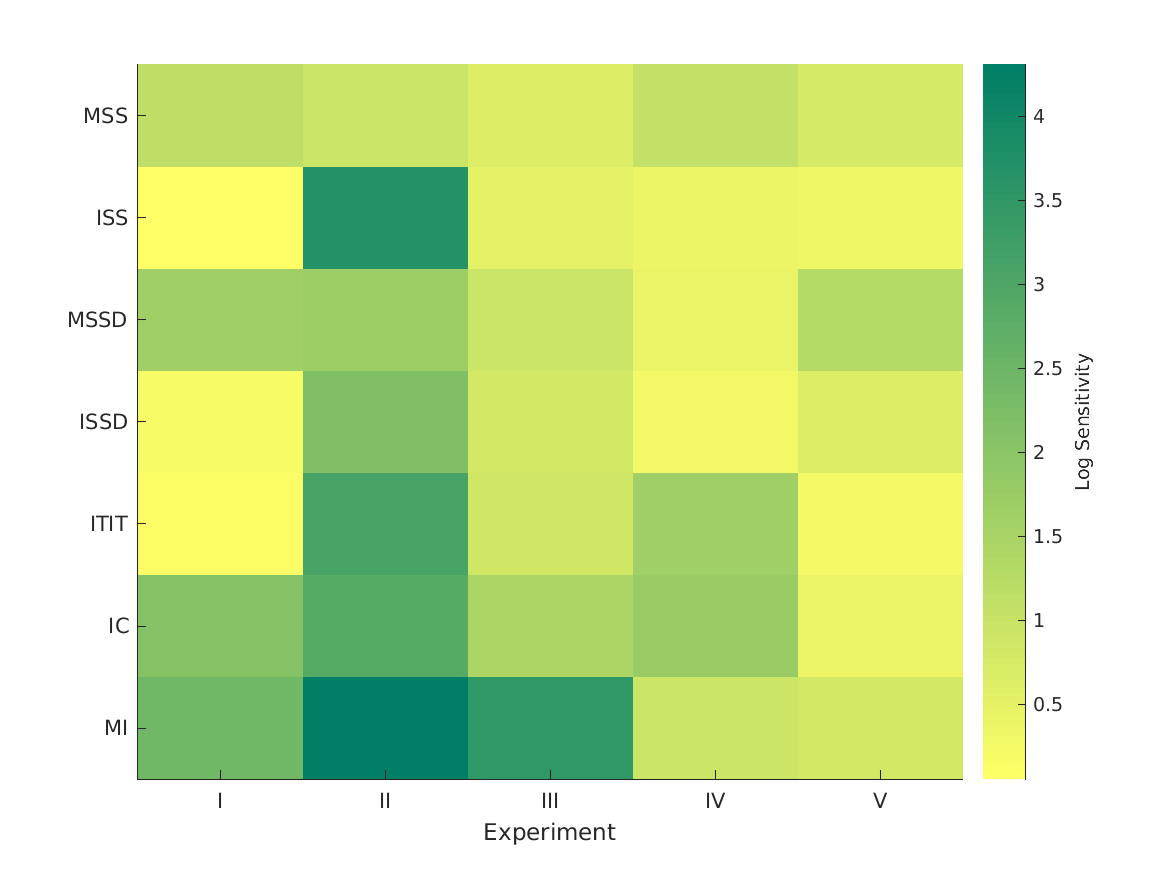
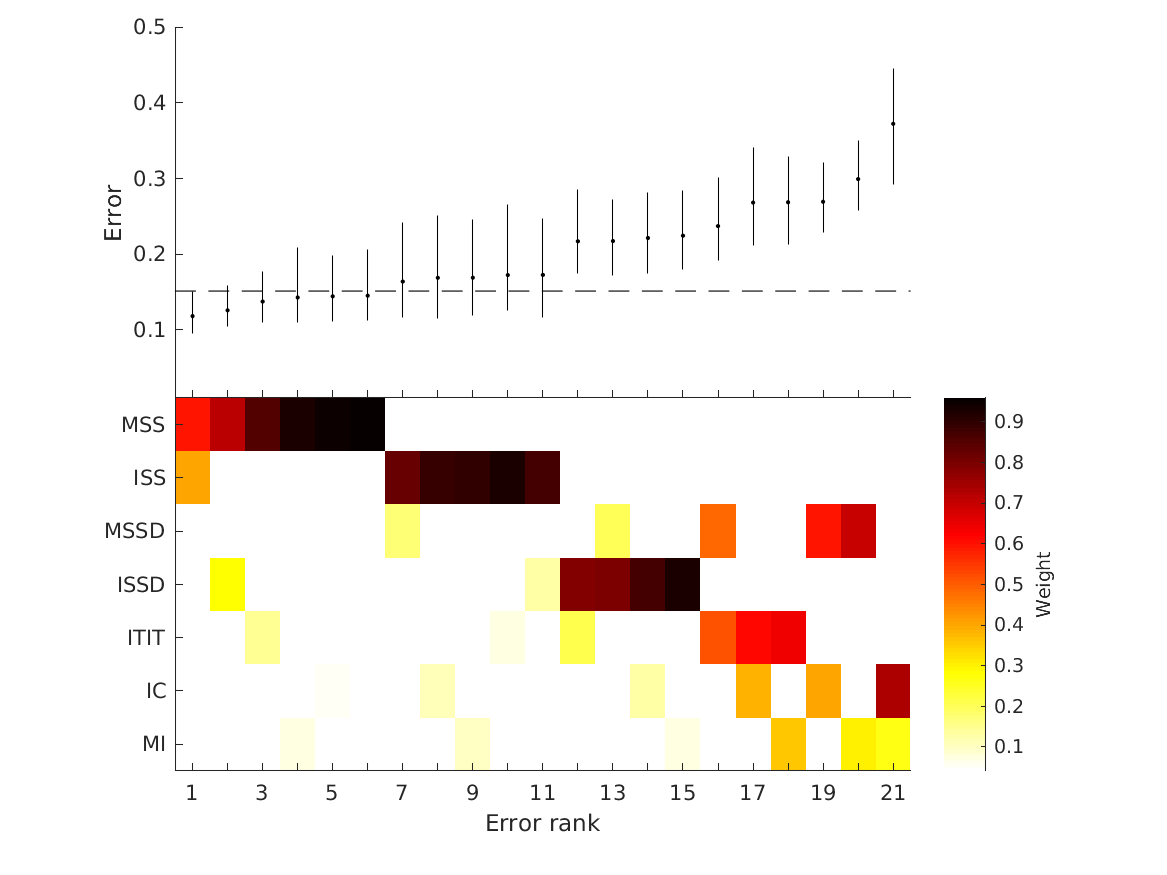
- fig2 shows cue-specific predictions, sensitivities, prediction errors,
- and optimal relative weights in order to best explain the actual externalization ratings. Oracle: prediction errors obtained with the oracle model.
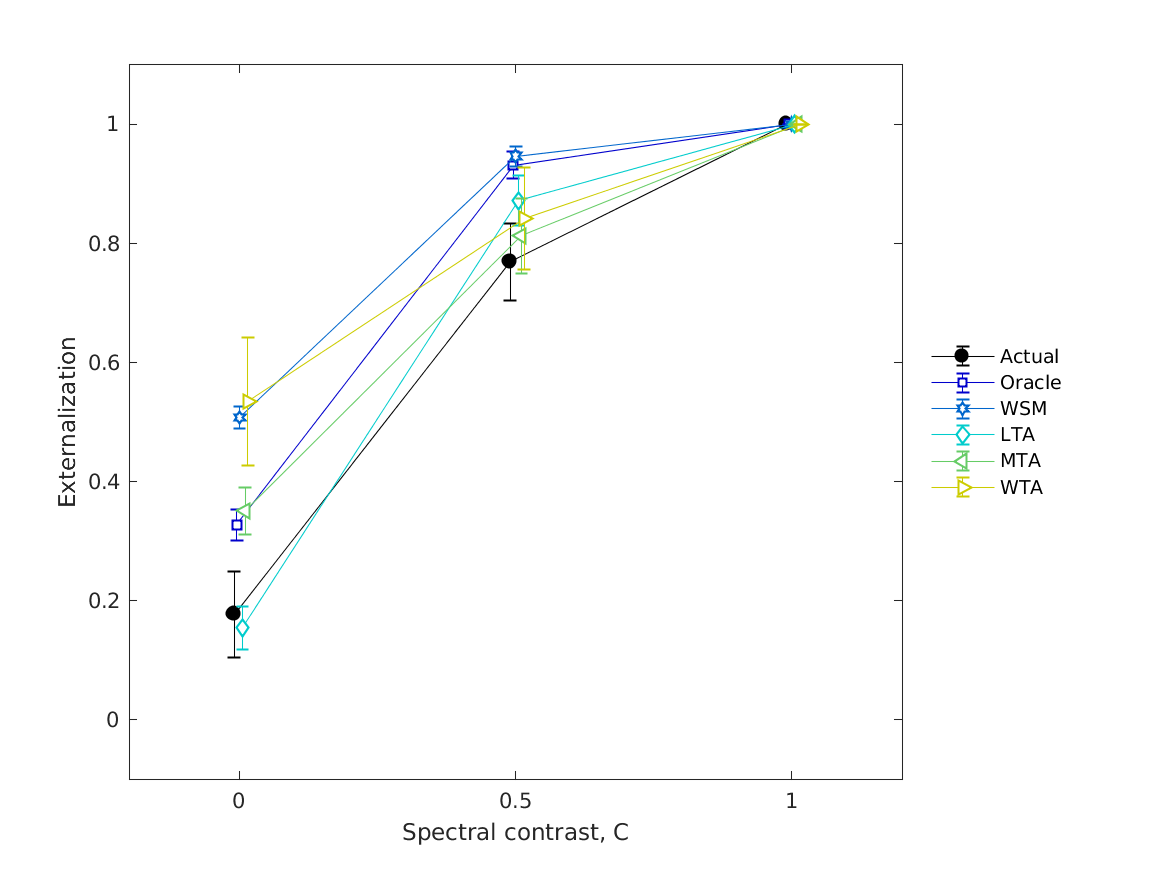
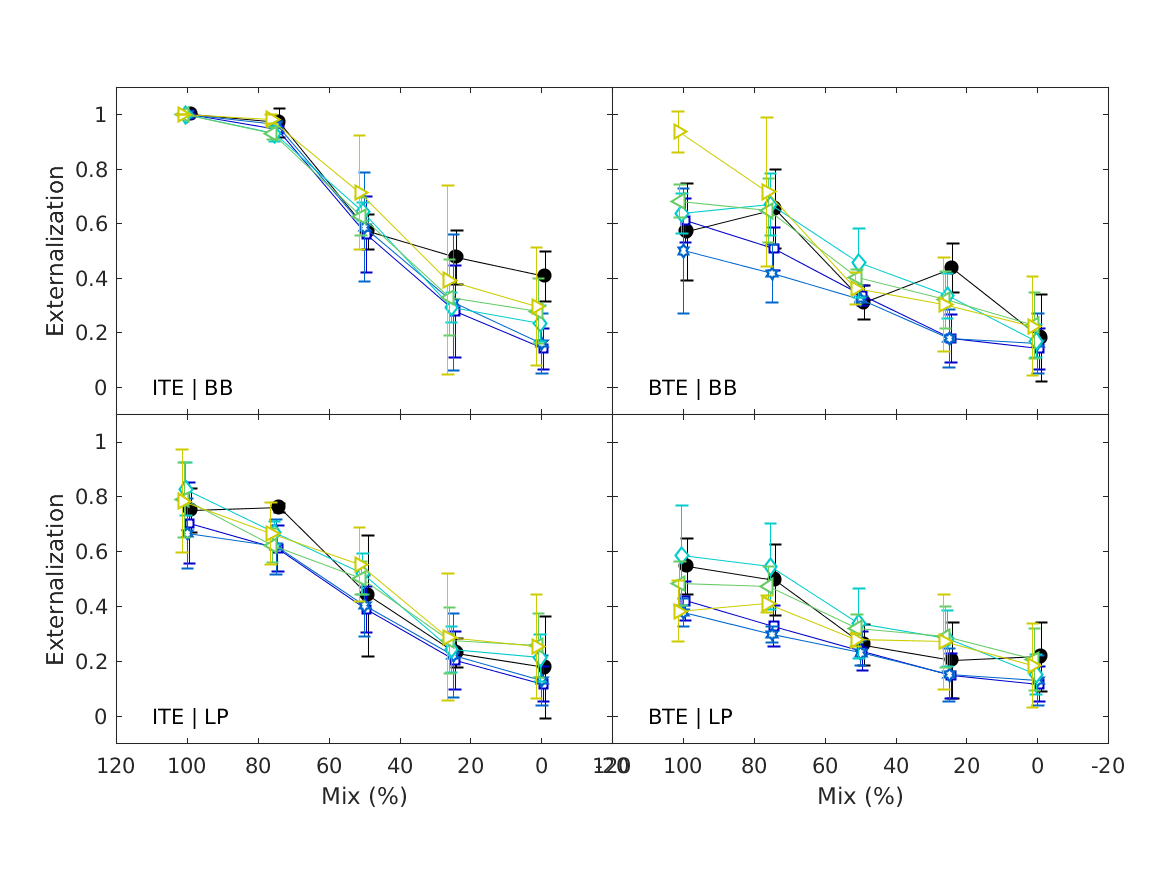
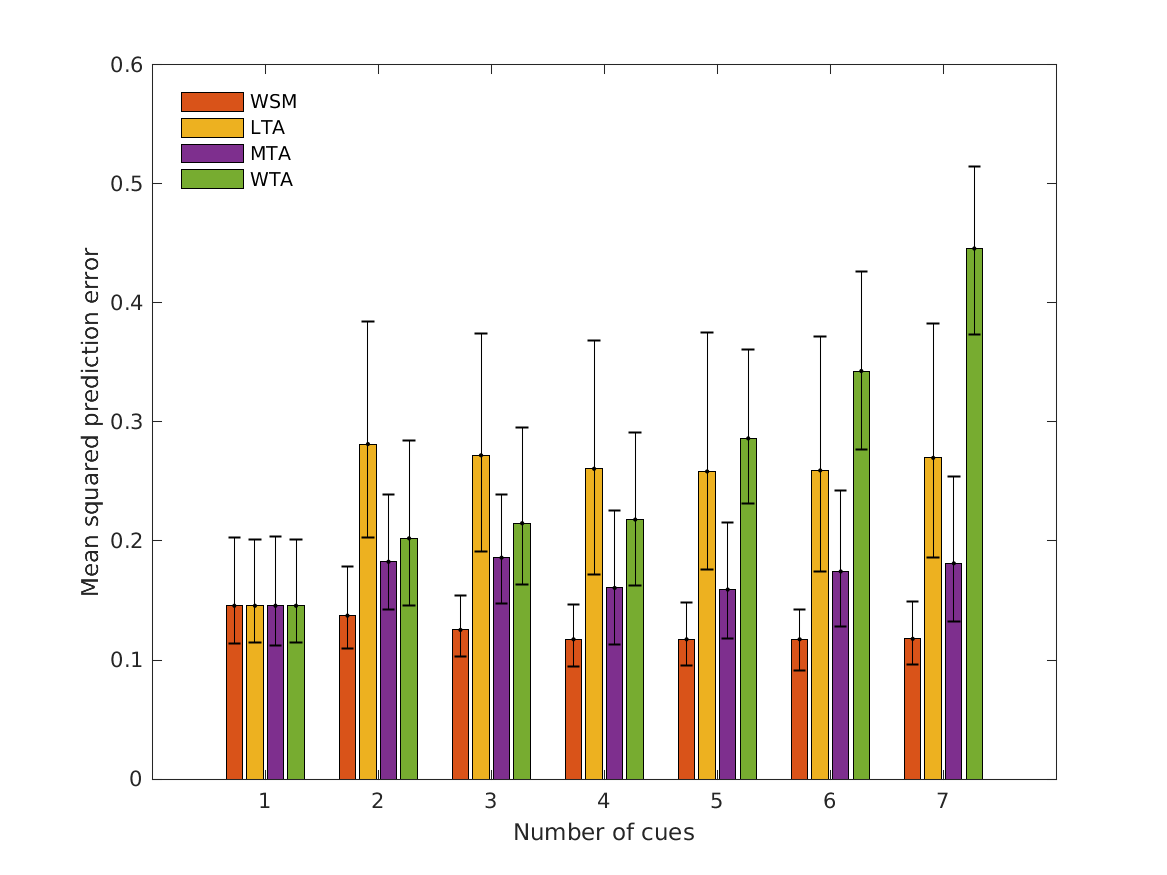
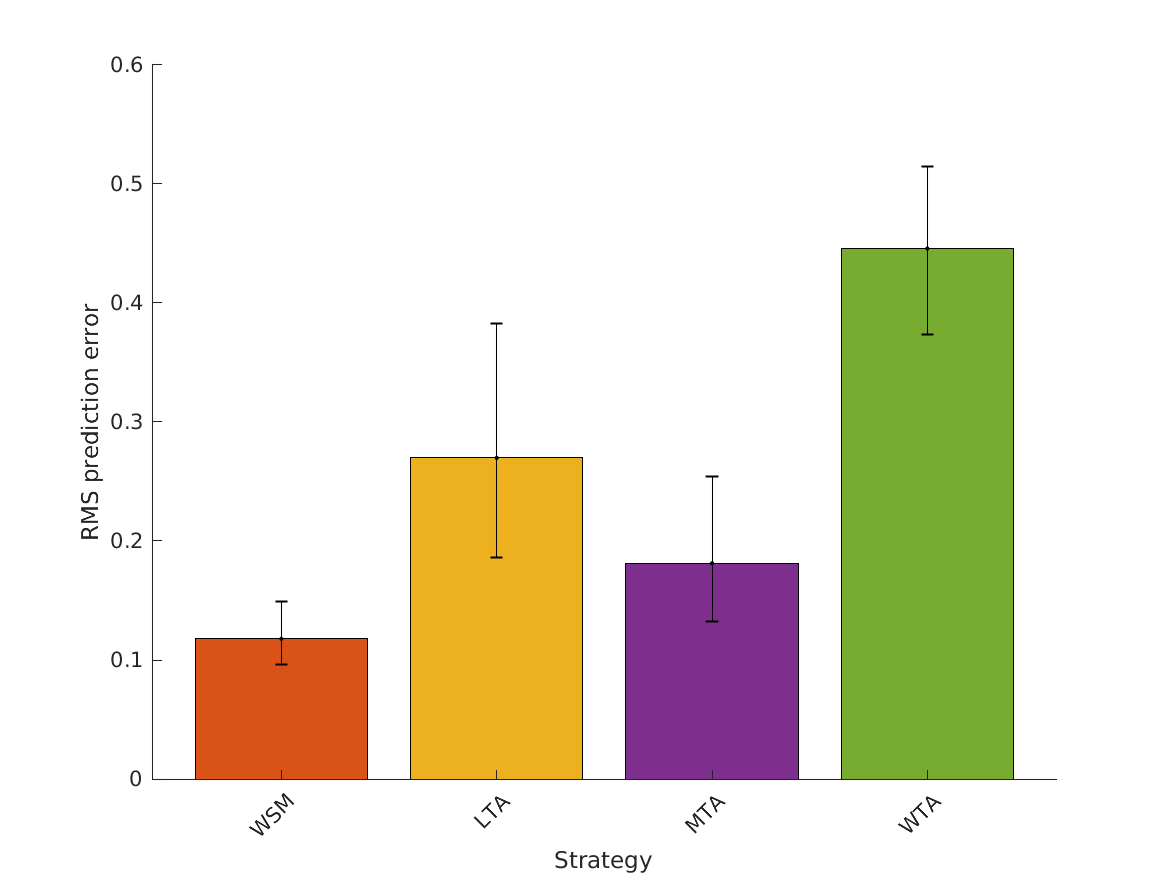
- fig3 displays the prediction errors for all decision strategies,
- optimal cue weights and results for paired combinations.
- hartmann1996 models experiments from Hartmann & Wittenberg (1996; Fig.7-8)
- 1st panel: Synthesis of zero-ILD signals. Only the harmonics from 1 to nprime had zero interaural level difference; harmonics above nprime retained the amplitudes of the baseline synthesis. Externalization scores as a function of the boundary harmonic number nprime. Fundamental frequency of 125 Hz. 2nd panel: Synthesis of signals to test the ISLD hypothesis. Harmonics at and below the boundary retained only the interaural spectral level differences of the baseline synthesis. Higher harmonics retained left and right baseline harmonic levels. Externalization scores as a function of the boundary frequency.
- hassager2016 models experiments from Hassager et al. (2016; Fig.6).
- The mean of the seven listeners perceived sound source location (black) as a function of the bandwidth factor and the corresponding model predictions (colored). The model predictions have been shifted slightly to the right for a better visual interpretation. The error bars are one standard error of the mean.
- baumgartner2017 models experiments from Baumgartner et al. (2017).
- Effect of HRTF spectral contrast manipulations on sound externalization. Externalization scores were derived from paired comparisons via Bradley-Terry-Luce modeling.
- boyd2012 models experiments from Boyd et al. (2012; Fig.1, top).
- Average externalization ratings of 1 talker for NH participants against mix point as a function of microphone position (ITE/BTE) and frequency response (BB/LP). The reference condition (ref) is the same as ITE/BB. Error bars show SEM.
Requirements:
- SOFA API v0.4.3 or higher from http://sourceforge.net/projects/sofacoustics for Matlab (in e.g. thirdparty/SOFA)
- Data in hrtf/baumgartner2017
- Statistics Toolbox for Matlab (for some of the figures)
Examples:
To display indivdual predictions for all experiments use
exp_baumgartner2021('fig2');
This code produces the following output:
hartmann1996, Exp. 1
Showing modelling details for hartmann1996_exp1
S_cue Error Weight Description
_________ _________ _______ ______________________________________________________________________________________
MSS 0.073828 0.081818 0 'Monaural positive spectral gradients (c.f., Baumgartner et al., 2014)'
ISS 0.88369 0.011274 0 'Interaural spectral shape (c.f., Hassager et al., 2016)'
MSSD 0.021484 0.042295 0 'Spectral SD of monaural positive spectral gradients (c.f., Baumgartner et al., 2014)'
ISSD 0.62119 0.052943 0 'Spectral SD of interaural spectral differences (c.f., Georganti et al., 2013)'
ITIT 0.79141 0.0035124 0.69234 'Interaural time-intensity trading (ITD vs. ILD)'
IC 0.0083008 0.0047487 0.18995 'Interaural coherence (c.f., Hassager et al., 2017)'
MI 0.0038086 0.012103 0.11771 'Monaural intensity difference (target - reference)'
Oracle NaN 0.0038405 NaN 'Weighted combination'
Showing cue contributions for hartmann1996_exp1
MSS ISS MSSD ISSD ITIT IC MI Error_Oracle Error_WSM Error_LTA Error_MTA Error_WTA BIC_Oracle BIC_WSM BIC_LTA BIC_MTA BIC_WTA
________ ___ ________ ____ _______ _______ _______ ____________ _________ _________ _________ _________ __________ ________ _______ _______ _______
MSS, ISS, MSSD, ISSD, ITIT, IC, MI 0.071595 0 0.084639 0 0.13799 0.58691 0.11886 0.0060689 0.023193 0.016062 0.027608 0.022957 -2.9907 3.7126 -9.3905 -6.6822 -7.6045
MSS, ISS, MSSD, ISSD, ITIT, IC 0 0 0.26045 0 0.11771 0.62184 NaN 0.0057589 0.020118 0.0084312 0.010345 0.010972 -6.4718 -0.21745 -14.222 -13.2 -12.905
MSS, ISS, ISSD, ITIT, IC 0.21613 0 NaN 0 0.1357 0.64817 NaN 0.008223 0.023686 0.026913 0.04029 0.049354 -7.9097 -2.62 -10.028 -8.011 -6.9965
MSS, ISS, ISSD, ITIT 0.46307 0 NaN 0 0.53693 NaN NaN 0.017392 0.029709 0.007816 0.010933 0.02827 -7.3832 -4.706 -17.82 -16.142 -11.392
MSS, ISSD, ITIT 0.46315 NaN NaN 0 0.53685 NaN NaN 0.017392 0.031557 0.0065232 0.027969 0.036925 -10.602 -7.6232 -20.334 -13.055 -11.666
MSS, ITIT 0.46309 NaN NaN NaN 0.53691 NaN NaN 0.017392 0.034445 0.0035632 0.010957 0.018707 -13.821 -10.404 -24.967 -19.35 -16.675
MSS 1 NaN NaN NaN NaN NaN NaN 0.091699 0.091699 0.081818 0.081818 0.081818 -8.7273 -8.7273 -10.907 -10.907 -10.907
hartmann1996, Exp. 2
Showing modelling details for hartmann1996_exp2
S_cue Error Weight Description
__________ __________ ________ ______________________________________________________________________________________
MSS 0.12051 0.0019367 0.019309 'Monaural positive spectral gradients (c.f., Baumgartner et al., 2014)'
ISS 0.00019531 0.063476 0 'Interaural spectral shape (c.f., Hassager et al., 2016)'
MSSD 0.019629 0.010901 0.34659 'Spectral SD of monaural positive spectral gradients (c.f., Baumgartner et al., 2014)'
ISSD 0.0069336 0.017217 0.032649 'Spectral SD of interaural spectral differences (c.f., Georganti et al., 2013)'
ITIT 0.00078125 0.0035481 0.4388 'Interaural time-intensity trading (ITD vs. ILD)'
IC 0.0012695 0.0049122 0.16266 'Interaural coherence (c.f., Hassager et al., 2017)'
MI 4.8828e-05 0.04627 0 'Monaural intensity difference (target - reference)'
Oracle NaN 0.00029003 NaN 'Weighted combination'
Showing cue contributions for hartmann1996_exp2
MSS ISS MSSD ISSD ITIT IC MI Error_Oracle Error_WSM Error_LTA Error_MTA Error_WTA BIC_Oracle BIC_WSM BIC_LTA BIC_MTA BIC_WTA
_______ ___ ______ _______ ____ ________ ________ ____________ _________ __________ _________ _________ __________ ________ _______ _______ ________
MSS, ISS, MSSD, ISSD, ITIT, IC, MI 0.66081 0 0.2029 0 0 0.093239 0.043051 0.016603 0.068566 0.010188 0.013991 0.22396 3.0155 8.6883 -8.6419 -7.3733 3.719
MSS, ISS, MSSD, ISSD, ITIT, IC 0.87483 0 0 0 0 0.12517 NaN 0.0056494 0.065774 0.0018328 0.002641 0.17217 -4.0693 5.7494 -16.89 -15.429 1.2807
MSS, ISS, ISSD, ITIT, IC 0.80456 0 NaN 0.19544 0 0 NaN 0.013594 0.066128 0.0001728 0.0038704 0.2513 -3.3296 2.9983 -27.722 -15.286 1.4071
MSS, ISS, ISSD, ITIT 1 0 NaN 0 0 NaN NaN 0.0026579 0.056353 5.5574e-09 0.017156 0.20467 -12.63 -0.41409 -70.487 -10.716 -0.80029
MSS, ISSD, ITIT 1 NaN NaN 0 0 NaN NaN 0.0026579 0.030535 0.0013744 0.0017853 0.035254 -15.403 -5.6378 -22.2 -21.154 -9.2218
MSS, ITIT 1 NaN NaN NaN 0 NaN NaN 0.0026579 0.024436 0.0015726 0.0013143 0.0035481 -18.176 -9.3016 -23.047 -23.765 -19.793
MSS 1 NaN NaN NaN NaN NaN NaN 0.0026579 0.0026579 0.0019367 0.0019367 0.0019367 -20.948 -20.948 -23.601 -23.601 -23.601
hassager2016
Showing modelling details for hassager2016
S_cue Error Weight Description
_________ _________ ________ ______________________________________________________________________________________
MSS 0.2293 0.0053458 0.57534 'Monaural positive spectral gradients (c.f., Baumgartner et al., 2014)'
ISS 0.33135 0.0047244 0.36112 'Interaural spectral shape (c.f., Hassager et al., 2016)'
MSSD 0.12402 0.088551 0 'Spectral SD of monaural positive spectral gradients (c.f., Baumgartner et al., 2014)'
ISSD 0.15986 0.025814 0.025209 'Spectral SD of interaural spectral differences (c.f., Georganti et al., 2013)'
ITIT 0.14082 0.035836 0.038331 'Interaural time-intensity trading (ITD vs. ILD)'
IC 0.035156 0.13813 0 'Interaural coherence (c.f., Hassager et al., 2017)'
MI 0.0003418 0.19711 0 'Monaural intensity difference (target - reference)'
Oracle NaN 0.0028219 NaN 'Weighted combination'
Showing cue contributions for hassager2016
MSS ISS MSSD ISSD ITIT IC MI Error_Oracle Error_WSM Error_LTA Error_MTA Error_WTA BIC_Oracle BIC_WSM BIC_LTA BIC_MTA BIC_WTA
_______ _______ ____ ________ _______ ___ ___ ____________ _________ _________ _________ _________ __________ _______ _______ _______ _______
MSS, ISS, MSSD, ISSD, ITIT, IC, MI 0.39849 0.40698 0 0.085589 0.10894 0 0 0.0032588 0.016475 0.0066971 0.011033 0.20723 -82.706 -47.056 -88.496 -77.513 -12.989
MSS, ISS, MSSD, ISSD, ITIT, IC 0.29948 0.60597 0 0.076443 0.01811 0 NaN 0.0029749 0.024953 0.0039253 0.0081372 0.077533 -90.893 -44.104 -103.34 -87.303 -37.709
MSS, ISS, ISSD, ITIT, IC 0.26084 0.64136 NaN 0.097809 0 0 NaN 0.0029383 0.015921 0.0035608 0.002736 0.072175 -97.348 -60.173 -108.58 -114.37 -42.375
MSS, ISS, ISSD, ITIT 0.26542 0.64531 NaN 0.089275 0 NaN NaN 0.0029362 0.0042859 0.0029754 0.0026254 0.051861 -103.55 -95.225 -115.62 -118.37 -52.738
MSS, ISSD, ITIT 0.64931 NaN NaN 0 0.35069 NaN NaN 0.0042231 0.0047078 0.0084647 0.0037099 0.038776 -101.73 -99.341 -95.708 -113.86 -62.226
MSS, ITIT 0.64936 NaN NaN NaN 0.35064 NaN NaN 0.0042231 0.0049458 0.0029154 0.0060224 0.038461 -107.91 -104.44 -122.25 -106.29 -65.496
MSS 1 NaN NaN NaN NaN NaN NaN 0.021879 0.021879 0.0053458 0.0053458 0.0053458 -77.907 -77.907 -112 -112 -112
baumgartner2017
Showing modelling details for baumgartner2017
S_cue Error Weight Description
________ ________ _______ ______________________________________________________________________________________
MSS 0.087988 0.036517 0.56054 'Monaural positive spectral gradients (c.f., Baumgartner et al., 2014)'
ISS 0.4207 0.081148 0 'Interaural spectral shape (c.f., Hassager et al., 2016)'
MSSD 0.39395 0.036857 0.10583 'Spectral SD of monaural positive spectral gradients (c.f., Baumgartner et al., 2014)'
ISSD 0.50117 0.051565 0 'Spectral SD of interaural spectral differences (c.f., Georganti et al., 2013)'
ITIT 0.022559 0.13844 0 'Interaural time-intensity trading (ITD vs. ILD)'
IC 0.018164 0.062149 0.33363 'Interaural coherence (c.f., Hassager et al., 2017)'
MI 0.11279 0.12654 0 'Monaural intensity difference (target - reference)'
Oracle NaN 0.023715 NaN 'Weighted combination'
Showing cue contributions for baumgartner2017
MSS ISS MSSD ISSD ITIT IC MI Error_Oracle Error_WSM Error_LTA Error_MTA Error_WTA BIC_Oracle BIC_WSM BIC_LTA BIC_MTA BIC_WTA
_______ _________ ____ _________ ________ ________ ___ ____________ _________ _________ _________ _________ __________ ________ _________ _______ _______
MSS, ISS, MSSD, ISSD, ITIT, IC, MI 0.64838 0.012149 0 0.24297 0.020725 0.075782 0 0.031103 0.039787 0.076446 0.028399 0.14665 4.9692 5.7079 -0.023211 -2.9939 1.9311
MSS, ISS, MSSD, ISSD, ITIT, IC 0.60633 0.0081455 0 0 0 0.38552 NaN 0.025641 0.036983 0.025604 0.027244 0.1235 2.1926 3.2915 -4.4033 -4.217 0.31718
MSS, ISS, ISSD, ITIT, IC 0.66296 0 NaN 0.0054617 0 0.33157 NaN 0.025251 0.035843 0.048979 0.018166 0.11406 -0.05053 1.0003 -3.556 -6.5316 -1.02
MSS, ISS, ISSD, ITIT 0.77099 0 NaN 0.22901 0 NaN NaN 0.031347 0.047592 0.051862 0.029359 0.14939 -1.599 -0.34634 -4.4831 -6.19 -1.3092
MSS, ISSD, ITIT 0.77103 NaN NaN 0.22897 0 NaN NaN 0.031347 0.068016 0.032103 0.032686 0.12457 -3.7963 -1.4724 -7.0206 -6.9666 -2.9528
MSS, ITIT 1 NaN NaN NaN 0 NaN NaN 0.045874 0.075326 0.030911 0.048796 0.13084 -4.8511 -3.3633 -8.2327 -6.8631 -3.9041
MSS 1 NaN NaN NaN NaN NaN NaN 0.045874 0.045874 0.036517 0.036517 0.036517 -7.0484 -7.0484 -8.8313 -8.8313 -8.8313
boyd2012
Showing modelling details for boyd2012
S_cue Error Weight Description
________ ________ _______ ______________________________________________________________________________________
MSS 0.18057 0.042443 0.24038 'Monaural positive spectral gradients (c.f., Baumgartner et al., 2014)'
ISS 0.44687 0.028343 0.30127 'Interaural spectral shape (c.f., Hassager et al., 2016)'
MSSD 0.054395 0.10339 0 'Spectral SD of monaural positive spectral gradients (c.f., Baumgartner et al., 2014)'
ISSD 0.24404 0.032469 0 'Spectral SD of interaural spectral differences (c.f., Georganti et al., 2013)'
ITIT 0.54668 0.040747 0 'Interaural time-intensity trading (ITD vs. ILD)'
IC 0.36709 0.050289 0.30942 'Interaural coherence (c.f., Hassager et al., 2017)'
MI 0.15518 0.082215 0.14893 'Monaural intensity difference (target - reference)'
Oracle NaN 0.01466 NaN 'Weighted combination'
Showing cue contributions for boyd2012
MSS ISS MSSD ISSD ITIT IC MI Error_Oracle Error_WSM Error_LTA Error_MTA Error_WTA BIC_Oracle BIC_WSM BIC_LTA BIC_MTA BIC_WTA
_______ _______ _______ ____ ________ ___ ___ ____________ _________ _________ _________ _________ __________ _______ _______ _______ _______
MSS, ISS, MSSD, ISSD, ITIT, IC, MI 0.20981 0.63629 0.11231 0 0.041592 0 0 0.024676 0.04091 0.22043 0.029526 0.070926 -32.098 -21.987 -9.2732 -49.479 -31.952
MSS, ISS, MSSD, ISSD, ITIT, IC 0.18965 0.63326 0.13451 0 0.042584 0 NaN 0.024621 0.043919 0.028489 0.063165 0.092708 -38.134 -26.559 -53.19 -37.266 -29.592
MSS, ISS, ISSD, ITIT, IC 0.24005 0.68964 NaN 0 0.070312 0 NaN 0.026501 0.043818 0.032461 0.02756 0.055326 -42.654 -32.597 -53.576 -56.849 -42.912
MSS, ISS, ISSD, ITIT 0.23999 0.69008 NaN 0 0.06993 NaN NaN 0.026501 0.032026 0.059887 0.024031 0.044368 -48.645 -44.858 -44.323 -62.586 -50.322
MSS, ISSD, ITIT 0.48914 NaN NaN 0 0.51086 NaN NaN 0.033391 0.036857 0.02862 0.0302 0.046264 -50.015 -48.04 -62.086 -61.011 -52.48
MSS, ITIT 0.48905 NaN NaN NaN 0.51095 NaN NaN 0.033391 0.037232 0.02924 0.026657 0.04717 -56.007 -53.829 -64.653 -66.502 -55.089
MSS 1 NaN NaN NaN NaN NaN NaN 0.052145 0.052145 0.042443 0.042443 0.042443 -53.083 -53.083 -60.196 -60.196 -60.196
To display results for different decision strategies use
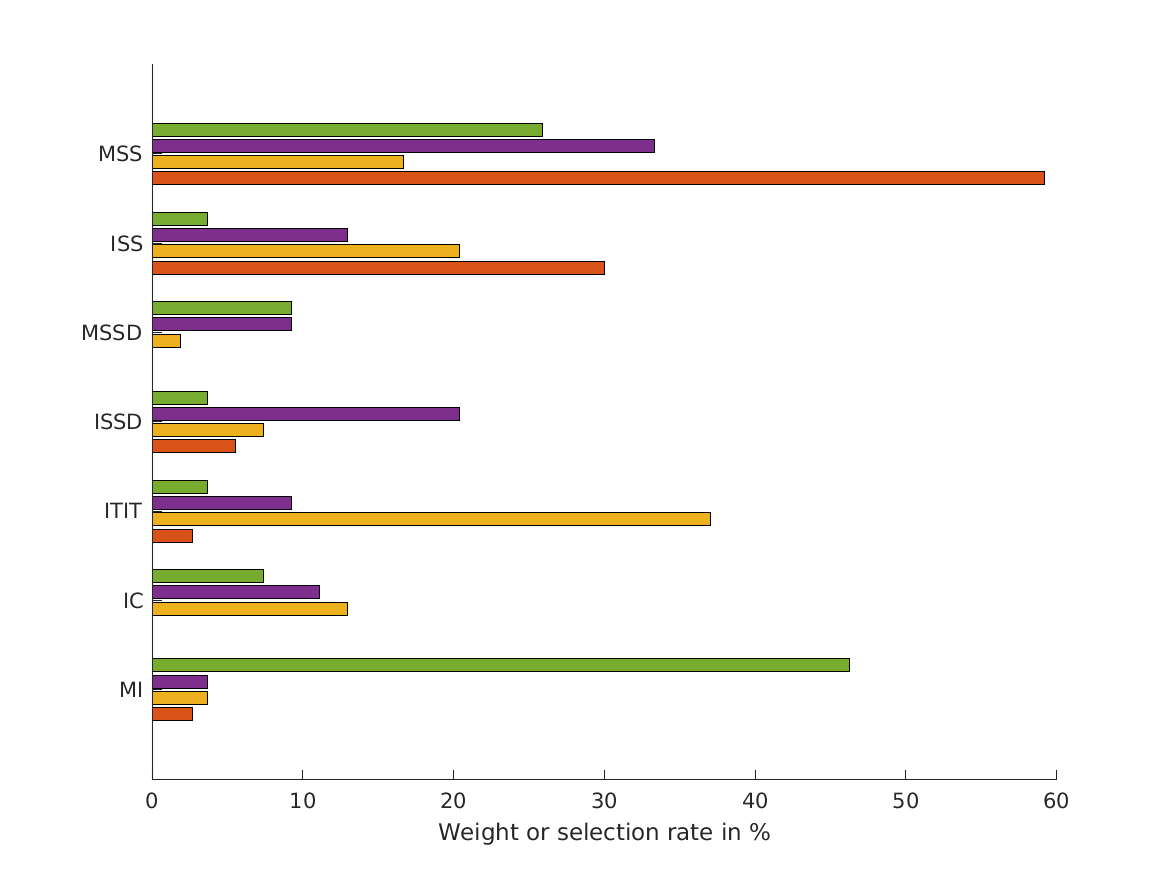
exp_baumgartner2021('fig3');
This code produces the following output:
Prediciton errors for tested decisions:
                                          RMSE_WSM    RMSE_LTA    RMSE_MTA    RMSE_WTA    BIC_WSM    BIC_LTA    BIC_MTA    BIC_WTA
                                          ________    ________    ________    ________    _______    _______    _______    _______

    MSS, ISS, MSSD, ISSD, ITIT, IC, MI    0.11786     0.26976     0.18126     0.44556     -175.09    -113.58    -156.52    -59.386
    MSS, ISS, MSSD, ISSD, ITIT, IC        0.11746     0.25919     0.17442     0.34271     -183.43    -121.89    -164.66     -91.72
    MSS, ISS, ISSD, ITIT, IC              0.11746     0.25839     0.15922     0.28616     -191.41    -126.21     -178.5    -115.19
    MSS, ISS, ISSD, ITIT                  0.11746     0.26063     0.16057     0.21795     -199.39    -129.27    -181.58    -148.58
    MSS, ISSD, ITIT                        0.1253     0.27192     0.18598     0.21488     -200.39    -128.68     -169.7     -154.1
    MSS, ITIT                             0.13732     0.28134     0.18255     0.20226     -198.47    -128.99     -175.7    -164.63
    MSS                                    0.1456      0.1456      0.1456      0.1456     -200.12    -204.11    -204.11    -204.11

WSM weights/percentages
                                            MSS        ISS      MSSD      ISSD        ITIT       IC        MI        RMSE        BIC
                                          _______    _______    ____    ________    _________    ___    ________    _______    _______

    MSS, ISS, MSSD, ISSD, ITIT, IC, MI    0.59174    0.30018      0     0.055064     0.026457      0    0.026563    0.11786    -175.09
    MSS, ISS, MSSD, ISSD, ITIT, IC        0.59433    0.32884      0     0.069708    0.0071173      0         NaN    0.11746    -183.43
    MSS, ISS, ISSD, ITIT, IC              0.59443    0.32873    NaN     0.069721    0.0071216      0         NaN    0.11746    -191.41
    MSS, ISS, ISSD, ITIT                  0.59436    0.32883    NaN     0.069703    0.0071109    NaN         NaN    0.11746    -199.39
    MSS, ISSD, ITIT                       0.70682        NaN    NaN      0.25484     0.038333    NaN         NaN     0.1253    -200.39
    MSS, ITIT                             0.85482        NaN    NaN          NaN      0.14518    NaN         NaN    0.13732    -198.47
    MSS                                         1        NaN    NaN          NaN          NaN    NaN         NaN     0.1456    -200.12

LTA weights/percentages
                                           MSS       ISS       MSSD      ISSD      ITIT       IC        MI       RMSE        BIC
                                          ______    ______    ______    ______    ______    ______    ______    _______    _______

    MSS, ISS, MSSD, ISSD, ITIT, IC, MI    16.667     20.37    1.8519    7.4074    37.037    12.963    3.7037    0.26976    -113.58
    MSS, ISS, MSSD, ISSD, ITIT, IC        12.963    22.222    5.5556    5.5556    40.741    12.963       NaN    0.25919    -121.89
    MSS, ISS, ISSD, ITIT, IC              12.963    31.481       NaN    9.2593    31.481    14.815       NaN    0.25839    -126.21
    MSS, ISS, ISSD, ITIT                  12.963    25.926       NaN    12.963    48.148       NaN       NaN    0.26063    -129.27
    MSS, ISSD, ITIT                        20.37       NaN       NaN    16.667    62.963       NaN       NaN    0.27192    -128.68
    MSS, ITIT                             33.333       NaN       NaN       NaN    66.667       NaN       NaN    0.28134    -128.99
    MSS                                      100       NaN       NaN       NaN       NaN       NaN       NaN     0.1456    -204.11

MTA weights/percentages
                                           MSS       ISS       MSSD      ISSD      ITIT       IC        MI       RMSE        BIC
                                          ______    ______    ______    ______    ______    ______    ______    _______    _______

    MSS, ISS, MSSD, ISSD, ITIT, IC, MI    33.333    12.963    9.2593     20.37    9.2593    11.111    3.7037    0.18126    -156.52
    MSS, ISS, MSSD, ISSD, ITIT, IC        31.481    12.963    16.667    31.481    3.7037    3.7037       NaN    0.17442    -164.66
    MSS, ISS, ISSD, ITIT, IC              27.778    16.667       NaN    25.926    16.667    12.963       NaN    0.15922     -178.5
    MSS, ISS, ISSD, ITIT                  40.741     29.63       NaN    22.222    7.4074       NaN       NaN    0.16057    -181.58
    MSS, ISSD, ITIT                       33.333       NaN       NaN        50    16.667       NaN       NaN    0.18598     -169.7
    MSS, ITIT                             87.037       NaN       NaN       NaN    12.963       NaN       NaN    0.18255     -175.7
    MSS                                      100       NaN       NaN       NaN       NaN       NaN       NaN     0.1456    -204.11

WTA weights/percentages
                                           MSS       ISS       MSSD      ISSD      ITIT       IC        MI       RMSE        BIC
                                          ______    ______    ______    ______    ______    ______    ______    _______    _______

    MSS, ISS, MSSD, ISSD, ITIT, IC, MI    25.926    3.7037    9.2593    3.7037    3.7037    7.4074    46.296    0.44556    -59.386
    MSS, ISS, MSSD, ISSD, ITIT, IC         20.37    3.7037    33.333         0    7.4074    35.185       NaN    0.34271     -91.72
    MSS, ISS, ISSD, ITIT, IC              31.481    12.963       NaN    14.815    12.963    27.778       NaN    0.28616    -115.19
    MSS, ISS, ISSD, ITIT                  55.556    14.815       NaN    16.667    12.963       NaN       NaN    0.21795    -148.58
    MSS, ISSD, ITIT                       61.111       NaN       NaN    27.778    11.111       NaN       NaN    0.21488     -154.1
    MSS, ITIT                             75.926       NaN       NaN       NaN    24.074       NaN       NaN    0.20226    -164.63
    MSS                                      100       NaN       NaN       NaN       NaN       NaN       NaN     0.1456    -204.11

Contributions and Prediction errors:
      MSS        ISS        MSSD       ISSD        ITIT         IC          MI       WSM_RMSE     CI_low     CI_high
    _______    _______    ________    _______    ________    ________    ________    ________    ________    _______

    0.59938    0.40062         NaN        NaN         NaN         NaN         NaN    0.11809     0.095138    0.15122
    0.71892        NaN         NaN    0.28108         NaN         NaN         NaN    0.12576      0.10422    0.15793
    0.85482        NaN         NaN        NaN     0.14518         NaN         NaN    0.13732      0.10948     0.1766
    0.92907        NaN         NaN        NaN         NaN         NaN     0.07093    0.14268      0.10912    0.20868
    0.94641        NaN         NaN        NaN         NaN    0.053586         NaN    0.14426      0.11123    0.19873
    0.95871        NaN    0.041292        NaN         NaN         NaN         NaN    0.14507      0.11242    0.20648
        NaN    0.82733     0.17267        NaN         NaN         NaN         NaN    0.16374      0.11605    0.24185
        NaN    0.89015         NaN        NaN         NaN     0.10985         NaN    0.16868      0.11486    0.25048
        NaN    0.90091         NaN        NaN         NaN         NaN    0.099093    0.16892      0.11857    0.24599
        NaN    0.92248         NaN        NaN    0.077521         NaN         NaN    0.17229      0.12508     0.2655
        NaN     0.8758         NaN     0.1242         NaN         NaN         NaN     0.1725      0.11671    0.24754
        NaN        NaN         NaN    0.78507     0.21493         NaN         NaN    0.21693      0.17414    0.28489
        NaN        NaN     0.20616    0.79384         NaN         NaN         NaN    0.21723      0.17219    0.27164
        NaN        NaN         NaN    0.87082         NaN     0.12918         NaN    0.22133      0.17412    0.28127
        NaN        NaN         NaN    0.92823         NaN         NaN    0.071767    0.22439      0.17918    0.28468
        NaN        NaN     0.48886        NaN     0.51114         NaN         NaN    0.23711      0.19133    0.30087
        NaN        NaN         NaN        NaN     0.61174     0.38826         NaN    0.26809        0.212    0.34092
        NaN        NaN         NaN        NaN     0.64537         NaN     0.35463    0.26855      0.21229    0.32877
        NaN        NaN     0.59676        NaN         NaN     0.40324         NaN     0.2692      0.22905    0.32112
        NaN        NaN     0.69367        NaN         NaN         NaN     0.30633    0.29922      0.25709    0.34991
        NaN        NaN         NaN        NaN         NaN     0.73255     0.26745    0.37218      0.29163    0.44536

Sensitivities:
      MSS        ISS        MSSD       ISSD       ITIT        IC         MI
    _______    _______    ________    _______    _______    _______    _______

    0.20029    0.51084         NaN        NaN        NaN        NaN        NaN
    0.20029        NaN         NaN    0.24854        NaN        NaN        NaN
    0.20029        NaN         NaN        NaN    0.49307        NaN        NaN
    0.20029        NaN         NaN        NaN        NaN        NaN    0.14482
    0.20029        NaN         NaN        NaN        NaN    0.33066        NaN
    0.20029        NaN    0.080273        NaN        NaN        NaN        NaN
        NaN    0.51084    0.080273        NaN        NaN        NaN        NaN
        NaN    0.51084         NaN        NaN        NaN    0.33066        NaN
        NaN    0.51084         NaN        NaN        NaN        NaN    0.14482
        NaN    0.51084         NaN        NaN    0.49307        NaN        NaN
        NaN    0.51084         NaN    0.24854        NaN        NaN        NaN
        NaN        NaN         NaN    0.24854    0.49307        NaN        NaN
        NaN        NaN    0.080273    0.24854        NaN        NaN        NaN
        NaN        NaN         NaN    0.24854        NaN    0.33066        NaN
        NaN        NaN         NaN    0.24854        NaN        NaN    0.14482
        NaN        NaN    0.080273        NaN    0.49307        NaN        NaN
        NaN        NaN         NaN        NaN    0.49307    0.33066        NaN
        NaN        NaN         NaN        NaN    0.49307        NaN    0.14482
        NaN        NaN    0.080273        NaN        NaN    0.33066        NaN
        NaN        NaN    0.080273        NaN        NaN        NaN    0.14482
        NaN        NaN         NaN        NaN        NaN    0.33066    0.14482
References:
A. W. Boyd, W. M. Whitmer, J. J. Soraghan, and M. A. Akeroyd. Auditory externalization in hearing-impaired listeners: The effect of pinna cues and number of talkers. J. Acoust. Soc. Am., 131(3):EL268--EL274, 2012. [ DOI | arXiv | www: ]
W. M. Hartmann and A. Wittenberg. On the externalization of sound images. J. Acoust. Soc. Am., 99(6):3678--88, June 1996. [ http ]
H. G. Hassager, F. Gran, and T. Dau. The role of spectral detail in the binaural transfer function on perceived externalization in a reverberant environment. J. Acoust. Soc. Am., 139(5):2992--3000, 2016. [ DOI | arXiv | www: ]


