THE AUDITORY MODELING TOOLBOX
This documentation page applies to an outdated AMT version (1.2.0). Click here for the most recent page.
DATA_TAKANEN2013 - Data applied in the model by Takanen, Santala and Pulkki
Usage
output = data_takanen2013(flag)
Description
data_takanen2013(flag) returns the data specified by the flag. The optional datasets are either matrices or structs containing data required in the different processing steps of the binaural auditory model by Takanen, Santala and Pulkki (2013).
The following flags can be specified:
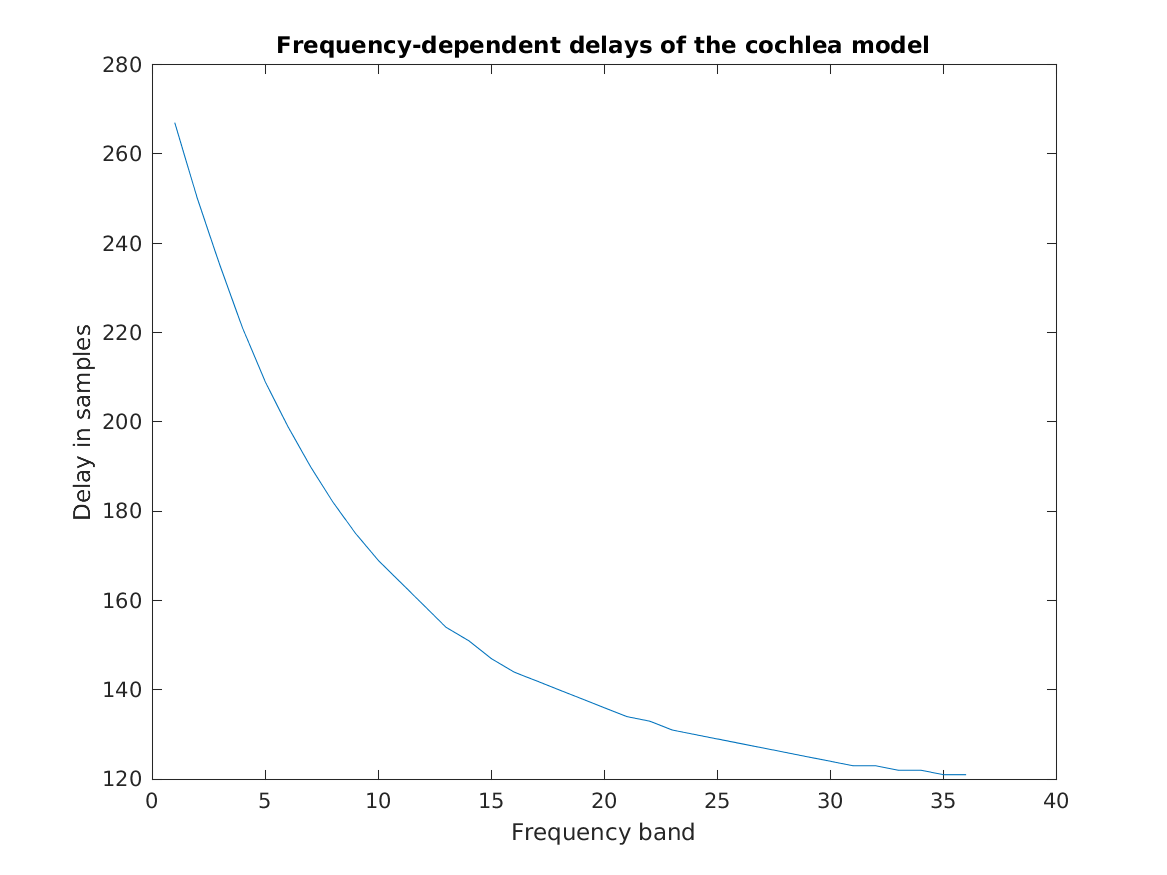
| 'cochleardelays' | Frequency-dependent delays of the cochlea model by Verhulst et al (2012) are compensated for in the takanen2013_periphery function. The delays were determined by analyzing the the cross-correlation- functions between different frequency bands. |
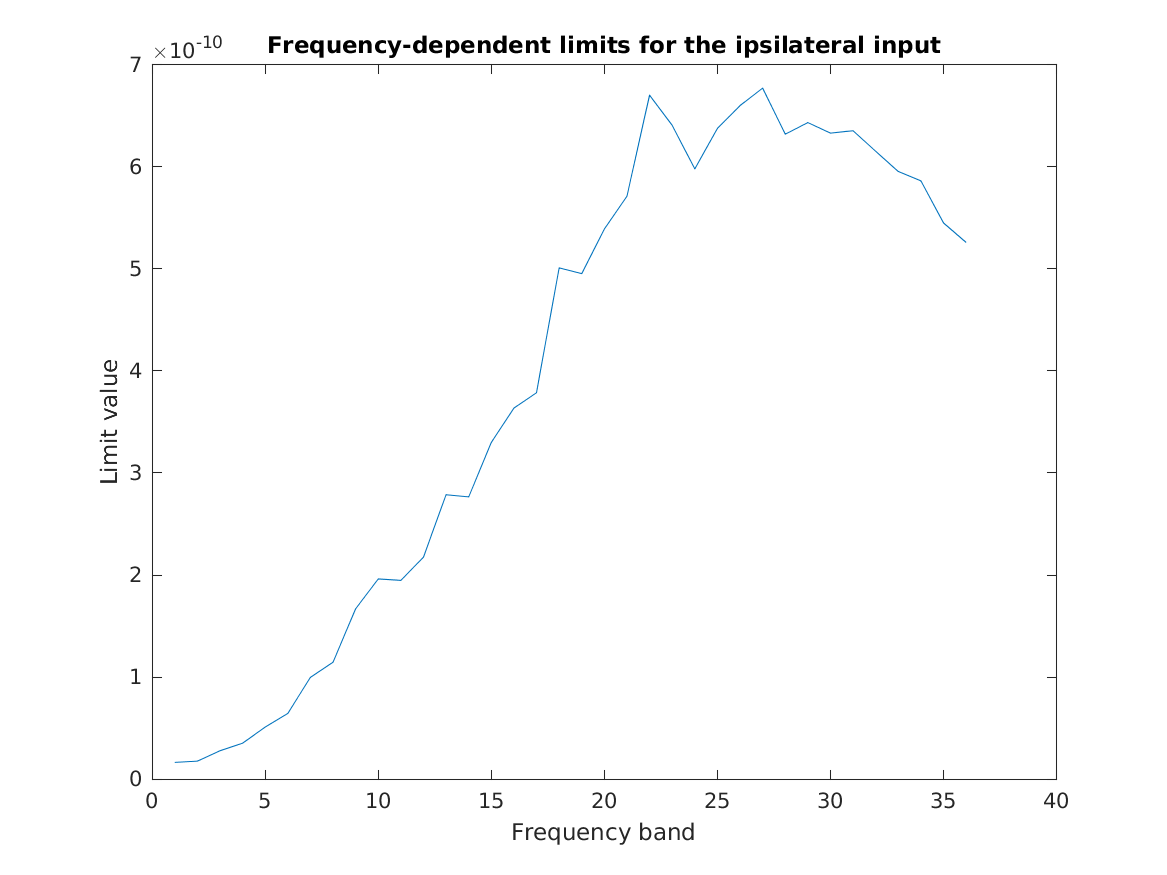
| 'msolimits' | In takanen2013_mso the ipsilateral input signals are divided by scaling values and thereafter limited between 0 and 1. The scaling values were obtained by computing the average level of the takanen2013_periphery output for a pink noise signal reproduced at 30 dB SPL |
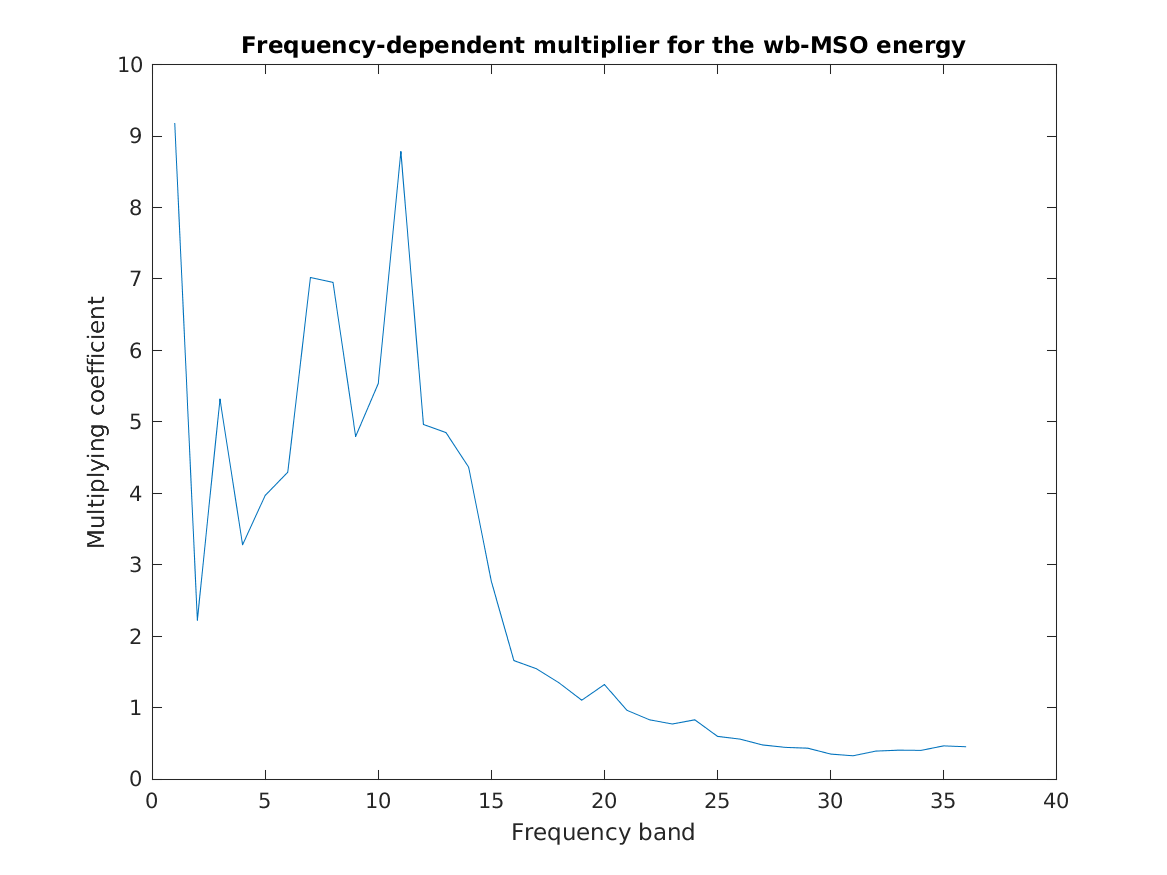
| 'wbmsomultp' | In takanen2013_wbmso the energy output is multiplied so that the energy of the wide-band MSO model is in a similar level as compared to the energies of the narrowband MSO and LSO models. The values with which the energy output is multiplied were obtained through an iterative process. |
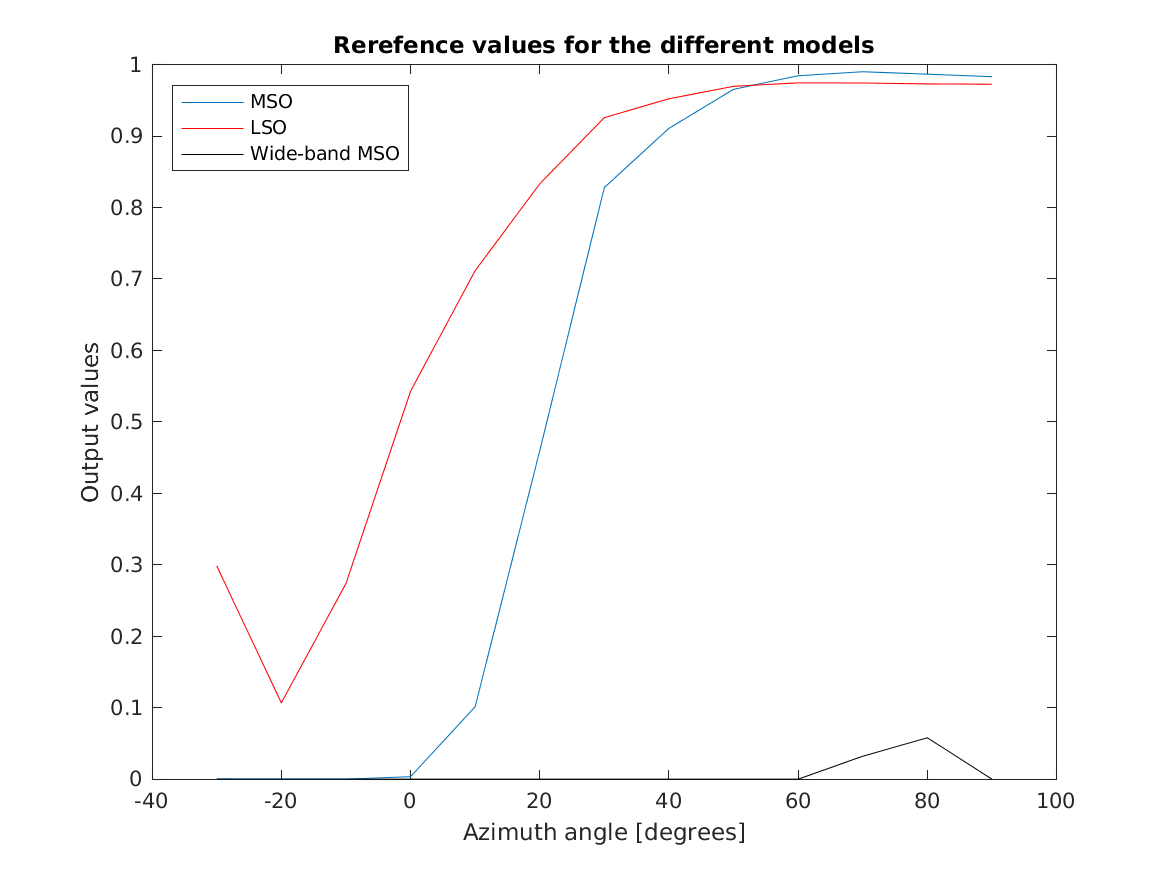
| 'lookuptable' | In takanen2013_directionmapping, the outputs of the different MSO and LSO models are mapped into directions ranging from -20 to 90. The mapping is implemented following the idea of self-calibration, where the outputs of the models are compared separately to sets of reference values computed with HRTF-processed samples. The sample employed for the MSO and the LSO models was a 80-ms-long pink noise burst, whereas the sample for the wide-band MSO model was a impulse response of a first-order Butterworth lowpass filter with a cut-off frequency of 500 Hz |
| 'onsetmultp' | In takanen2013_onsetenhancement the energies of the short-term and of the long-term directional cues are scaled to a similar level with the help of a set of pre- computed values, the values which were obtained by the computing the average levels of the two energies for a pink noise burst convolved with binaural room impulse response of a concert hall |
| 'periphenergyaverages' | |
| In takanen2013_formbinauralactivitymap the levels of the what cues are scaled in order to visualize the evoked activations on the binaural activity map. The values were obtained by computing the average levels of the what cue for a pink noise burst reproduced at 60 dB SPL. | |
| 'no_plot' | Don't plot, only return data. This is the default. |
| 'plot' | Plot the data. |
If no flag is given, the function will print the list of valid flags.
Examples:
To load and plot the pre-computed frequency-dependent cochlear model delays use:
data_takanen2013('cochleardelays','plot');
To load and plot the pre-computed ipsilateral limits for MSO model use:
data_takanen2013('msolimits','plot');
To load and plot the pre-computed wide-band MSO energy multiplier use:
data_takanen2013('wbmsomultp','plot');
To load and plot the reference values for the MSO and LSO models at different frequencies for directions use:
data_takanen2013('lookuptable','plot');
References:
M. Takanen, O. Santala, and V. Pulkki. Visualization of functional count-comparison-based binaural auditory model output. Hearing research, 309:147--163, 2014. PMID: 24513586. [ DOI ]
M. Takanen, O. Santala, and V. Pulkki. Perceptually encoded signals and their assessment. In J. Blauert, editor, The technology of binaural listening. Springer, 2013.
S. Verhulst, T. Dau, and C. A. Shera. Nonlinear time-domain cochlear model for transient stimulation and human otoacoustic emission. J. Acoust. Soc. Am., 132(6):3842 -- 3848, 2012.


Build with Bootstrap