THE AUDITORY MODELING TOOLBOX
This documentation page applies to an outdated AMT version (1.2.0). Click here for the most recent page.
PLOT_AUDSPECGRAM - Auditory spectrogram
Usage
plot_audspecgram(insig,fs,op1,op2, ... );
C=plot_audspecgram(insig,fs, ... );
Description
plot_audspecgram(insig,fs) plots an auditory spectrogram of the signal insig, which has been sampled at a sampling rate of fs Hz. The output is low-pass modulation filtered before presentation.
The frequency axis is diplayed on a erb-scale, but labelled in Hz. Using the mouse to get plot coordinates will reveal the real value in erb's. Use erbtofreq to convert to Hz.
C=plot_audspecgram(insig,fs, ... ) returns the image to be displayed as a matrix. Use this in conjunction with imwrite etc. Do not use this as a method to compute an auditory representation. Use some of the model preprocessing functions for this.
Additional arguments can be supplied like this:
plot_audspecgram(insig,fs,'dynrange',30);
The arguments must be character strings possibly followed by an argument:
| 'adt' | Model adaptation. This is the default. This options also sets the output to be displayed on a linear scale. |
| 'no_adt' | Do not model adaptation. This option also sets a dB scale to display the output. |
| 'ihc',modelname | Pass modelname to ihcenvelope to determine the inner hair cell envelope extraction process to use. Default is to use the 'dau' model. |
| 'classic' | Display a classic spectrogram. This option is equal to {'ihc','hilbert', 'no_adt', 'no_mf'} |
| 'mlp',f | Modulation low-pass filter to frequency f. Default is to low-pass filter to 50 Hz. |
| 'mf',f | Modulation filter with specified center frequency. |
| 'no_mf' | No modulation filtering of any kind. |
| 'image' | Use imagesc to display the spectrogram. This is the default. |
| 'clim',clim | Use a colormap ranging from \(clim(1)\) to \(clim(2)\). These values are passed to imagesc. See the help on imagesc. |
| 'dynrange',r | Limit the displayed dynamic range to r. This option is especially usefull when displaying on a dB scale (no adaptation). |
| 'fullrange' | Use the full dynamic range. This is the default. |
| 'ytick' | A vector containing the frequency in Hz of the yticks. |
| 'thr',r | Keep only the largest fraction r of the coefficients, and set the rest to zero. |
| 'frange',frange | Choose a frequency scale ranging from \(frange(1)\) to \(frange(2)\), values are entered in Hz. Default is to display from 0 to 8000 Hz. |
| 'xres',xres | Approximate number of pixels along x-axis / time. |
| 'yres',yres | Approximate number of pixels along y-axis / frequency If only one of 'xres' and 'yres' is specified, the default aspect ratio will be used. |
| 'displayratio',r | Set the default aspect ratio. |
| 'contour' | Do a contour plot to display the spectrogram. |
| 'surf' | Do a surf plot to display the spectrogram. |
| 'mesh' | Do a mesh plot to display the spectrogram. |
| 'colorbar' | Display the colorbar. This is the default. |
| 'no_colorbar' | Do not display the colorbar. |
Examples:
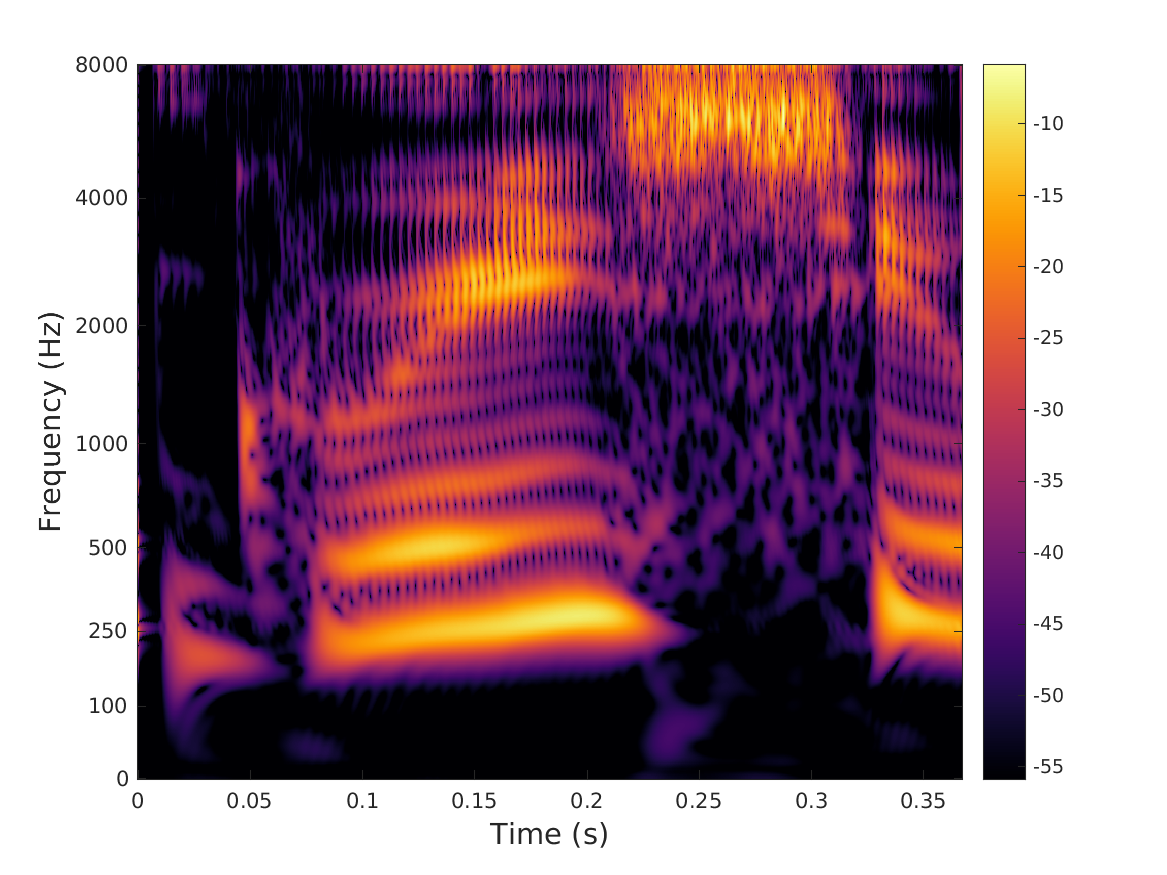
The following figure shows a classic spectrogram on an Erb scale of a spoken word:
plot_audspecgram(greasy,16000,'classic','dynrange',50);
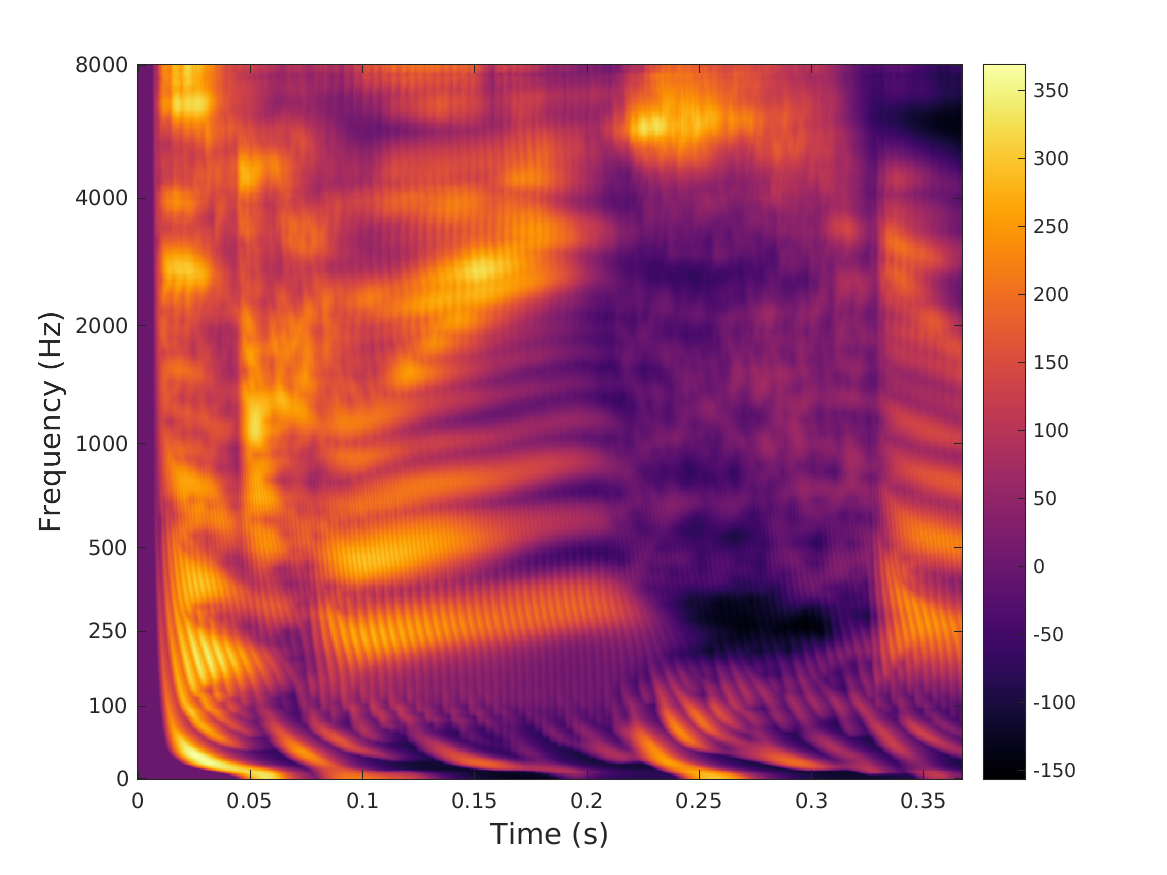
The next example shows a Dau-style spectrogram (including adaptation and modulation low-pass filtering) of the same word:
plot_audspecgram(greasy,16000);


Build with Bootstrap