THE AUDITORY MODELING TOOLBOX
This documentation page applies to an outdated major AMT version. We show it for archival purposes only.
Click here for the documentation menu and here to download the latest AMT (1.6.0).
Go to function
DATA_ELBERLING2010 - ABR wave V data as functon of level and sweeping rate
Usage
data = data_elberling2010(flag)
Output parameters
| delay | "x-axis" - sweeping rate delay between 710Hz and 5700Hz |
| data_mean | Mean of data |
| data_std | Standard deviation of data |
data_elberling2010(flag) returns data points from the Elberling et al. (2010)
The flag may be one of:
| 'noplot' | Don't plot, only return data. This is the default. |
| 'plot' | Plot the data. |
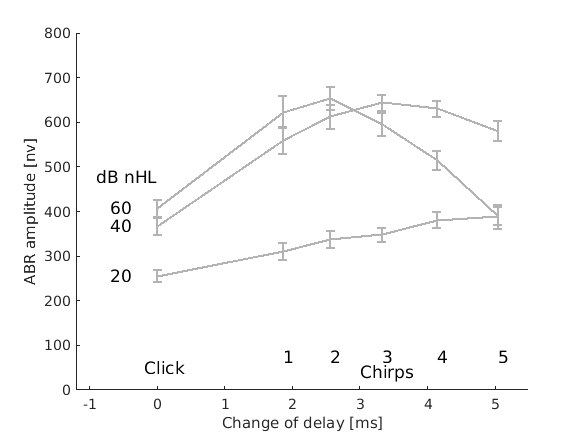
| 'fig4' | Data from Fig. 4, Amplitude of wave V. |
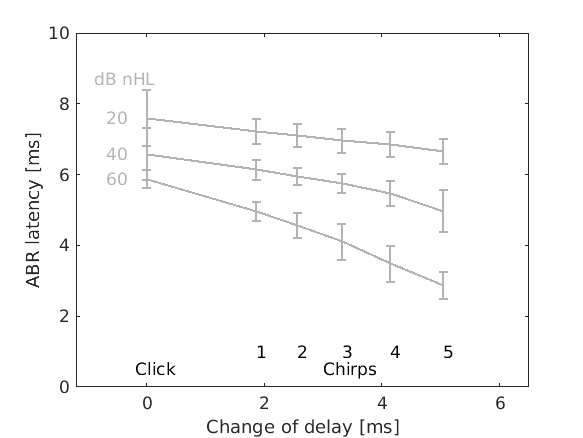
| 'fig5' | Data from Fig. 5, Latency of wave V |
| 'stim' | Return the stimulus and the sampling frequency. XXX Describe the data. XXX change 'stim' to figure no., if applicable. |
Examples:
Figure 4 can be displayed using:
data_elberling2010('fig4','plot');


Figure 5 can be displayed using:
data_elberling2010('fig5','plot');

References:
C. Elberling, J. Calloe, and M. Don. Evaluating auditory brainstem responses to different chirp stimuli at three levels of stimulation. J. Acoust. Soc. Am., 128(1):215--223, 2010.


