THE AUDITORY MODELING TOOLBOX
This documentation page applies to an outdated major AMT version. We show it for archival purposes only.
Click here for the documentation menu and here to download the latest AMT (1.6.0).
Go to function
DATA_NEELY1988 - ABR wave V data as functon of level and sweeping rate
Usage
tau = data_neely1988(flag)
Input parameters
| F | Centre frequencies of stimulus |
| L | Levels at centre frequencies |
Output parameters
| tau | Wave V latency |
data_neely1988(F,L) returns data points based on equation 1 from Neely et al. (1988) where F is the centre frequencies and L are the associated levels.
The flag may be one of:
| 'noplot' | Don't plot, only return data. This is the default. |
| 'plot' | Plot the data. |
Examples:
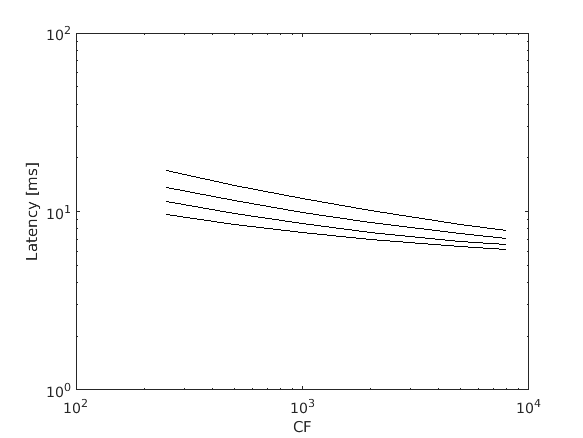
Figure 2 in Neely et al. (1988) can be reproduced using:
F=[250 500 1000 2000 5000 8000];
tau=data_neely1988(F,[40 60 80 100]);
loglog(F,tau','k-');
xlabel('CF');
ylabel('Latency [ms]')
References:
S. Neely, S. Norton, M. Gorga, and J. W. Latency of auditory brain-stem responses and otoacoustic emissions using tone-burst stimuli. J. Acoust. Soc. Am., 83(2):652--656, feb 1988.


Build with Bootstrap