THE AUDITORY MODELING TOOLBOX
This documentation page applies to an outdated major AMT version. We show it for archival purposes only.
Click here for the documentation menu and here to download the latest AMT (1.6.0).
EXP_BAUMGARTNER2017 - - Experiments of Baumgartner et al. (2017)
Usage
data = exp_baumgartner2017(flag)
exp_baumgartner2017(flag) reproduces figures of the study from Baumgartner et al. (2017).
The following flags can be specified
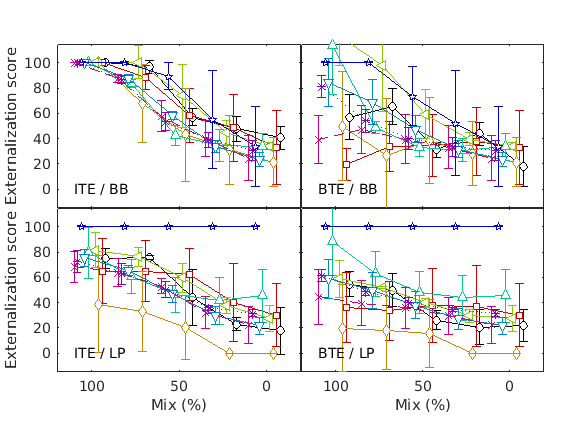
- boyd2012 models experiments from Boyd et al. (2012; Fig.1, top).
- Average externalization ratings of 1 talker for NH participants against mix point as a function of microphone position (ITE/BTE) and frequency response (BB/LP). The reference condition (ref) is the same as ITE/BB. Error bars show SEM.
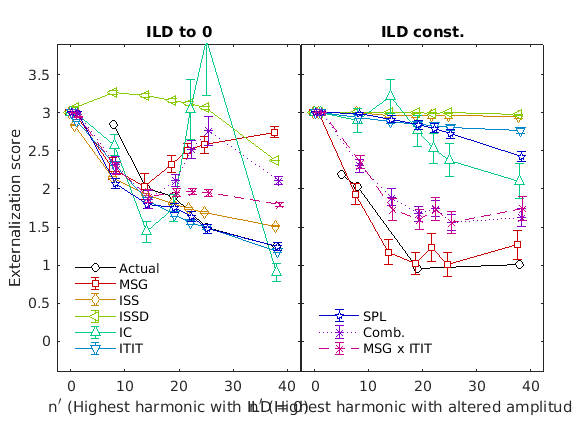
- hartmann1996 models experiments from Hartmann & Wittenberg (1996; Fig.7-8)
- 1st panel: Synthesis of zero-ILD signals. Only the harmonics from 1 to nprime had zero interaural level difference; harmonics above nprime retained the amplitudes of the baseline synthesis. Externalization scores as a function of the boundary harmonic number nprime. Fundamental frequency of 125 Hz. 2nd panel: Synthesis of signals to test the ISLD hypothesis. Harmonics at and below the boundary retained only the interaural spectral level differences of the baseline synthesis. Higher harmonics retained left and right baseline harmonic levels. Externalization scores as a function of the boundary frequency.
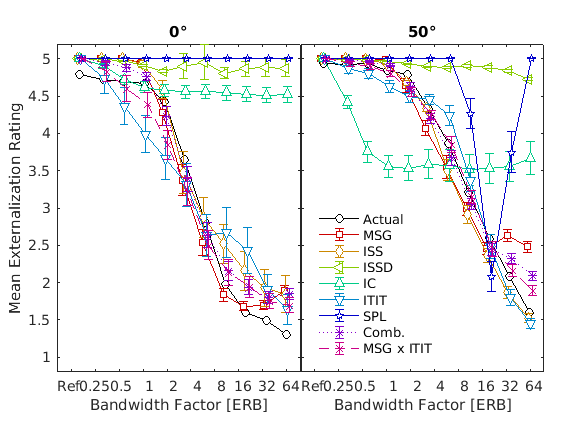
- hassager2016 models experiments from Hassager et al. (2016; Fig.6).
- The mean of the seven listeners perceived sound source location (black) as a function of the bandwidth factor and the corresponding model predictions (colored). The model predictions have been shifted slightly to the right for a better visual interpretation. The error bars are one standard error of the mean.
- baumgartner2017 models experiments from Baumgartner et al. (2017).
- Effect of HRTF spectral contrast manipulations on sound externalization. Externalization scores were derived from paired comparisons via Bradley-Terry-Luce modeling.
Requirements:
- SOFA API v0.4.3 or higher from http://sourceforge.net/projects/sofacoustics for Matlab (in e.g. thirdparty/SOFA)
- Data in hrtf/baumgartner2017
- Statistics Toolbox for Matlab (for some of the figures)
Examples:
To display results for Fig.1 from Boyd et al. (2012) use
exp_baumgartner2017('boyd2012');
This code produces the following output:
boyd2012
                  Sensitivity     Error       Weight                                    Description
                  ___________    _______    __________    _______________________________________________________________________

    MSG            0.4291        0.28535       0.25031    'Monaural spectral gradients (c.f., Baumgartner et al., 2014)'
    ISS           0.71543        0.36192      0.059306    'Interaural spectral shape (c.f., Hassager et al., 2016)'
    ISSD          0.45381        0.24804       0.12689    'Interaural spectral standard deviation (c.f., Georganti et al., 2013)'
    ITSD                1            NaN             0    'Interaural temporal standard deviation (c.f., Catic et al., 2015)'
    IC            0.27637        0.23606       0.35923    'Interaural coherence (c.f., Hassager et al., 2017)'
    ITIT          0.80947        0.18182       0.20368    'Interaural time-intensity trading (ITD vs. ILD)'
    SPL            1.7519         0.4995    0.00058575    'Level difference (target - reference)'
    Comb.             NaN        0.15591           NaN    'Weighted sum'
    MSG x ITIT        NaN        0.21109           NaN    'MSG x ITIT interaction'

To display results for Fig.7-8 from Hartmann & Wittenberg (1996) use
exp_baumgartner2017('hartmann1996');
This code produces the following output:
hartmann1996
                  Sensitivity    ErrorExp1    ErrorExp2     Error       Weight                                    Description
                  ___________    _________    _________    _______    __________    _______________________________________________________________________

    MSG             0.20449       0.29203     0.052801      0.2205       0.62854    'Monaural spectral gradients (c.f., Baumgartner et al., 2014)'
    ISS               1.414       0.11607      0.50888     0.35011    0.00077653    'Interaural spectral shape (c.f., Hassager et al., 2016)'
    ISSD              4.214       0.39239      0.51638     0.45172    0.00011457    'Interaural spectral standard deviation (c.f., Georganti et al., 2013)'
    ITSD                  1           NaN          NaN         NaN             0    'Interaural temporal standard deviation (c.f., Catic et al., 2015)'
    IC            0.0089844       0.22577      0.35734     0.29167       0.24021    'Interaural coherence (c.f., Hassager et al., 2017)'
    ITIT             1.0986      0.090058      0.47245     0.32204     0.0020065    'Interaural time-intensity trading (ITD vs. ILD)'
    SPL              2.7142       0.12651      0.44078     0.30861       0.12835    'Level difference (target - reference)'
    Comb.               NaN           NaN          NaN     0.17234           NaN    'Weighted combination'
    MSG x ITIT          NaN           NaN          NaN     0.14508           NaN    'MSG x ITIT interaction'

To display results for Fig.6 from Hassager et al. (2016) use
exp_baumgartner2017('hassager2016');
This code produces the following output:
hassager2016
                  Sensitivity     Error       Weight                                    Description
                  ___________    _______    __________    _______________________________________________________________________

    MSG             0.3626       0.17626       0.59273    'Monaural spectral gradients (c.f., Baumgartner et al., 2014)'
    ISS            0.50225       0.23999       0.21295    'Interaural spectral shape (c.f., Hassager et al., 2016)'
    ISSD             3.932       0.63248     0.0022428    'Interaural spectral standard deviation (c.f., Georganti et al., 2013)'
    ITSD                 1           NaN             0    'Interaural temporal standard deviation (c.f., Catic et al., 2015)'
    IC            0.081836       0.55002    0.00021247    'Interaural coherence (c.f., Hassager et al., 2017)'
    ITIT           0.22705       0.31173       0.19016    'Interaural time-intensity trading (ITD vs. ILD)'
    SPL           0.058594       0.61416     0.0017045    'Level difference (target - reference)'
    Comb.              NaN       0.14777           NaN    'Weighted combination'
    MSG x ITIT         NaN        0.1931           NaN    'MSG x ITIT interaction'

hassager2016 baumgartner2017
References:
R. Baumgartner, P. Majdak, H. Colburn, and B. Shinn-Cunningham. Modeling sound externalization based on listener-specific spectral cues. In Acoustics ‘17 Boston: The 3rd Joint Meeting of the Acoustical Society of America and the European Acoustics Association, Boston, MA, Jun 2017. [ DOI ]
A. W. Boyd, W. M. Whitmer, J. J. Soraghan, and M. A. Akeroyd. Auditory externalization in hearing-impaired listeners: The effect of pinna cues and number of talkers. J. Acoust. Soc. Am., 131(3):EL268--EL274, 2012. [ DOI | arXiv | www: ]
W. M. Hartmann and A. Wittenberg. On the externalization of sound images. J. Acoust. Soc. Am., 99(6):3678--88, June 1996. [ http ]


