THE AUDITORY MODELING TOOLBOX
This documentation page applies to an outdated major AMT version. We show it for archival purposes only.
Click here for the documentation menu and here to download the latest AMT (1.6.0).
EXP_DAU1997 - -
Usage
data = exp_dau1997(flags)
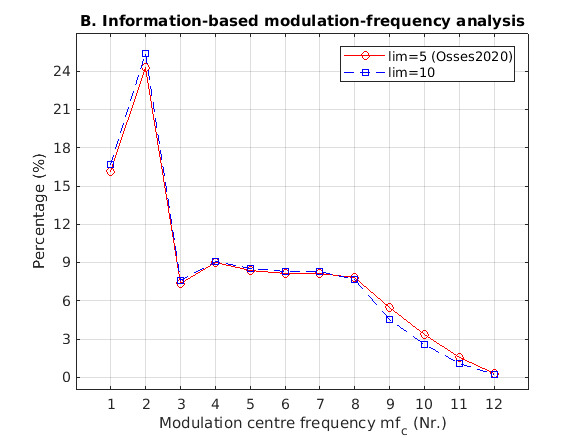
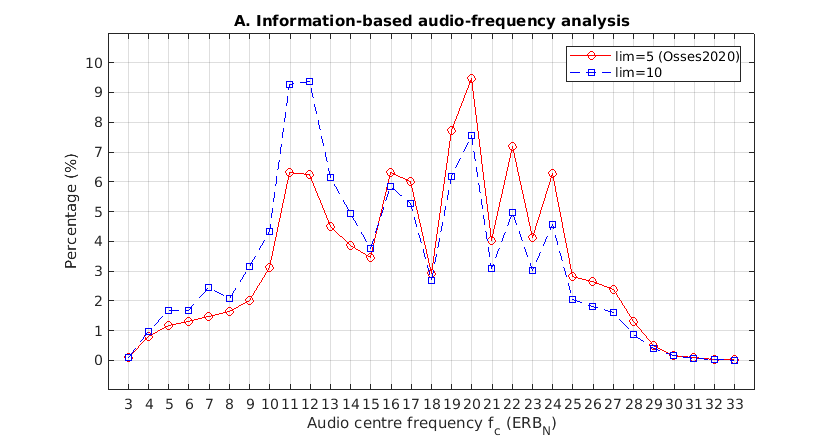
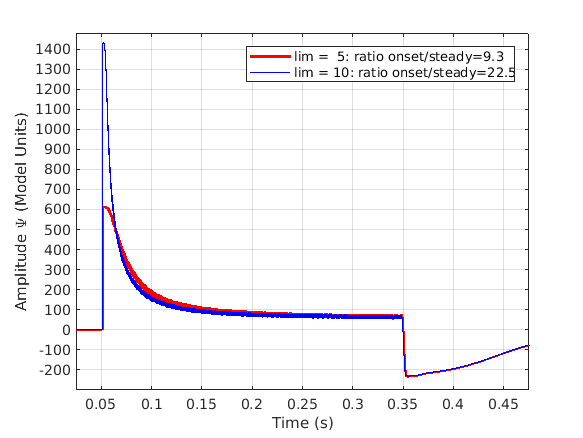
exp_dau1997 reproduces Figs. 4 and 14 from Osses et al. (2020), where the dau1997 model was used. The figures are similar to Figs. 4.14, C.9B, and C.11B from Osses (2018).
The following flags can be specified;
| 'redo' | Recomputes data for specified figure |
| 'plot' | Plot the output of the experiment. This is the default. |
| 'noplot' | Don't plot, only return data. |
| 'fig4_osses2020' | Reproduce Fig. 4 of Osses et al. (2020). |
| 'fig14_osses2020' | Reproduce Fig. 14 of Osses et al. (2020). |
Fig. 4 - Two internal representations of a piano sound ('P1') using the PEMO model with two configurations of the adaptation loops are shown: Overshoot limitation with a factor of 5, as suggested in Osses et al. (2020), and with a factor of 10 (see, Dau et al., 1997). To display Fig. 4 of Osses et al. (2020) use
out = exp_dau1997('fig4_osses2020');


Fig. 14 - The effect of the overshoot limitation with factors of 5 and 10 are shown for a 4-kHz pure tone of 70 dB SPL that includes 2.5-ms up/down ramps. For these plots the outer and middle ear stages are skipped. One gammatone filter at 4 kHz is used, followed by the ihc stage (ihc_breebaart), and the adaptation loops (adt_osses2020 for lim=5, adt_dau for lim=10). To display Fig. 14 of Osses et al. (2020) use
out = exp_dau1997('fig14_osses2020');
This code produces the following output:
Lim  5: Onset = 614.3 MU, steady = 66.2 MU
Lim 10: Onset = 1432.3 MU, steady = 63.7 MU

References:
T. Dau, B. Kollmeier, and A. Kohlrausch. Modeling auditory processing of amplitude modulation. I. Detection and masking with narrow-band carriers. J. Acoust. Soc. Am., 102:2892--2905, 1997a.


