THE AUDITORY MODELING TOOLBOX
This documentation page applies to an outdated major AMT version. We show it for archival purposes only.
Click here for the documentation menu and here to download the latest AMT (1.6.0).
EXP_TAKANEN2013 - Figures from Takanen, Santala, Pulkki (2013a,2013b)
Usage
output = exp_takanen2013(flag)
exp_takanen2013(flag) reproduces the figure given by flag either from the Takanen et al. (2013) book chapter or the Takanen et al. (2014) manuscript. The format of its output depends on the chosen figure. Optionally, pre-computed cochlear model outputs for the different scenarios can be applied to significantly reduce the required computation time. The pre-computed cochlear model outputs can be obtained from the authors.
The following flags can be specified:
| 'binsig' | This option computes the figures from the binaural signals. |
| 'cochlea' | This option uses pre-computed cochlea-model outputs and thus reduces the computation time. (Default). |
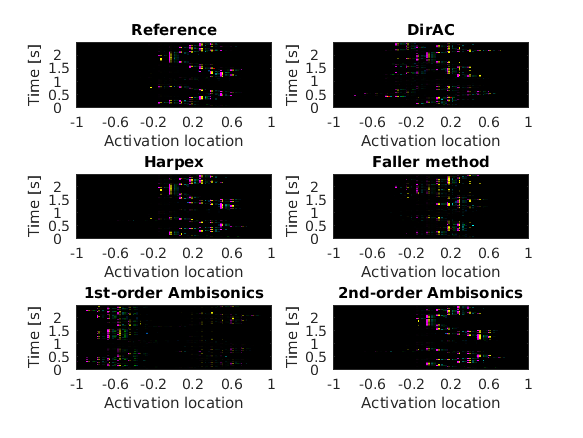
| 'fig8' | Figure 8 from the book chapter Takanen et al. (2013). Binaural activity maps obtained with the model for an off-sweet-spot listening scenario with different audio coding techniques. |
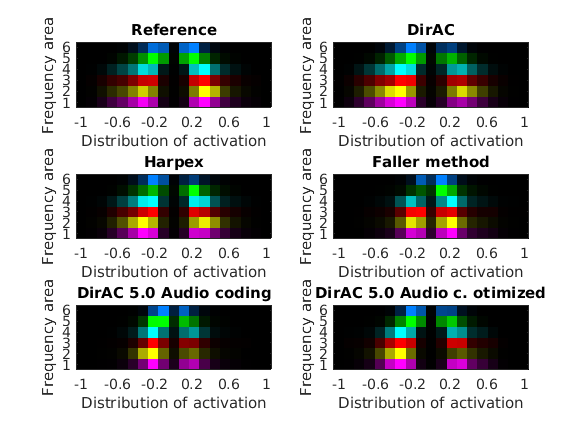
| 'fig9' | Figure 9 from the book chapter Takanen et al. (2013). Activation distributions obtained with the model for (a) the reference scenario of incoherent pink noise emitted from twelve azimuth directions, and (b)-(d) the reproduction of such a scenario with an eight-channel loudspeaker system employing signals obtained with different audio coding techniques. Additionally, the the distributions when DirAC is used in audio coding of 5.0 surround signal having incoherent pink noise in each channel with (e) the straightforward method and (f) the even-layout method. |
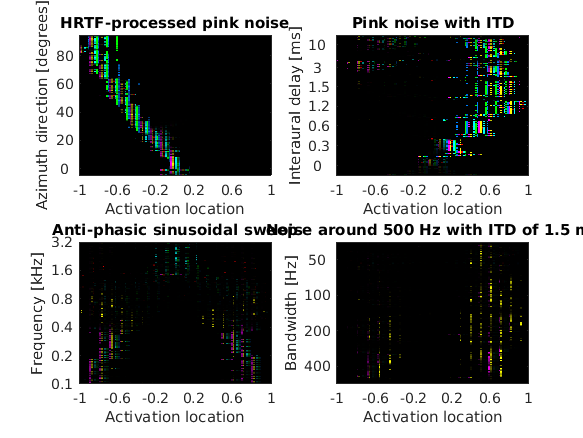
| 'fig7_takanen2014' | Figure 7 from the article Takanen et al. (2014). Binaural activity maps for four binaural listening scenarios, namely (a) HRTF-processed pink noise, (b) pink noise with ITD, (c) anti-phasic sinusoidal sweep, and (d) band- limited noise centered around 500 Hz with an ITD of 1.5 ms. |
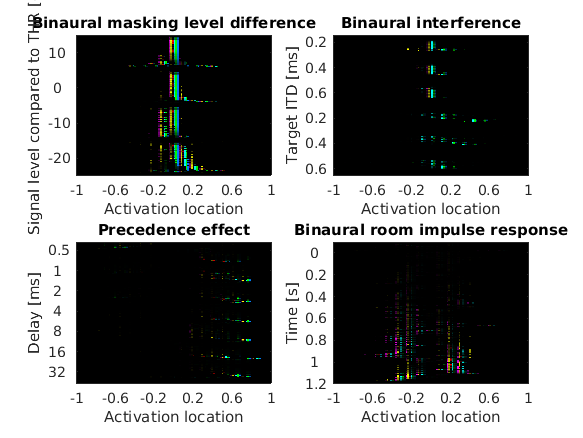
| 'fig8_takanen2014' | Figure 8 from the article Takanen et al. (2014). Binaural activity maps for four binaural listening scenarios, namely (a) \(S_\pi N_0\) with different signal-to-noise ratios, (b) binaural interference, (c) precedence effect, and (d) binaural room impulse response. |
If no flag is given, the function will print the list of valid flags.
Requirements and installation:
- Functioning model verhulst2012 (see the corresponding requirements)
- Data from www.acoustics.hut.fi/publications/papers/AMTool2013-bam/ in amtbase/signals
- at least 3 GB of RAM
Examples:
To display Figure 8 from the book chapter Takanen et al. (2013) using pre-computed cochlea model outputs use:
exp_takanen2013('fig8','cochlea');

To display Figure 9 from the book chapter Takanen et al. (2013) using pre-computed cochlea model outputs use:
exp_takanen2013('fig9','cochlea');

To display Figure 7 from the article Takanen et al. (2014) using pre-computed cochlea model outputs use:
exp_takanen2013('fig7_takanen2014','cochlea');

To display Figure 8 the article Takanen et al. (2014) using pre-computed cochlea model outputs use:
exp_takanen2013('fig8_takanen2014','cochlea');

References:
M. Takanen, O. Santala, and V. Pulkki. Visualization of functional count-comparison-based binaural auditory model output. Hearing research, 309:147--163, 2014. PMID: 24513586. [ DOI ]
M. Takanen, O. Santala, and V. Pulkki. Perceptually encoded signals and their assessment. In J. Blauert, editor, The technology of binaural listening. Springer, 2013.


