THE AUDITORY MODELING TOOLBOX
This documentation page applies to an outdated major AMT version. We show it for archival purposes only.
Click here for the documentation menu and here to download the latest AMT (1.6.0).
EXP_WIERSTORF2013 - Figures from Wierstorf (2013)
Usage
output = exp_wierstorf2013(flag)
exp_wierstorf2013(flag) reproduces the results for the figure given by flag from the Wierstorf (2013) paper. It will also plot the results. The format of its output depends on the chosen figure.
exp_wierstorf2013 requires the Sound-Field-Synthesis Toolbox version 2.4.0 or higher.
The following flags can be specified;
| 'plot' | plot the output of the experiment. This is the default. |
| 'noplot' | Don't plot, only return data. |
| 'auto' | Re-calculate the file if it does not exist. Return 1 if the file exist, otherwise 0. This is the default |
| 'redo' | Always recalculate the file. |
| 'cached' | Always use the cached version. Throws an error if the file does not exist. |
| 'fig1' | Reproduce Fig.1 from Wierstorf (2013). The localization error for a typical stereophony setup is calculated and shown for the whole listening are, sampled with 21x21 point. |
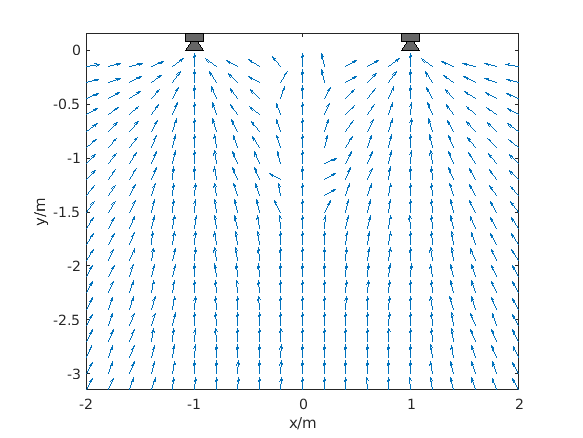
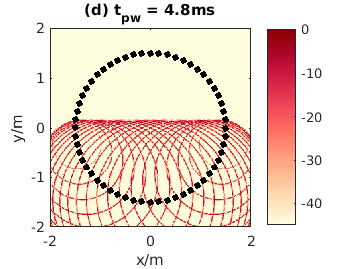
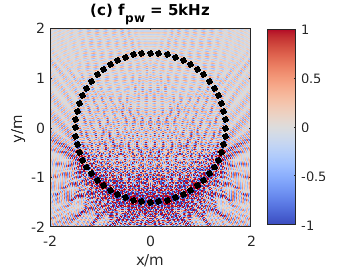
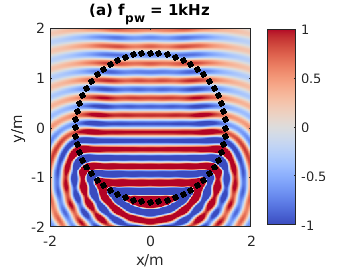
| 'fig3' | Simulations of the sound field for Wave Field Synthesis for a mono-frequent virtual plane wave with three different frequencies of 1kHz, 2kHz, 5kHz. In addition a spatio-temporal impulse response of the sound field for a broadband plane wave is shown at the time 4.8ms after its start. |
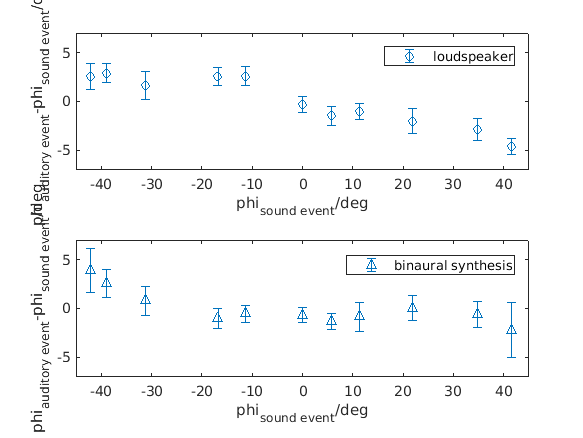
| 'fig6' | Results from an experiment comparing the localization accuracy for a real point source (loudspeaker) and a simulated point source (binaural synthesis). |
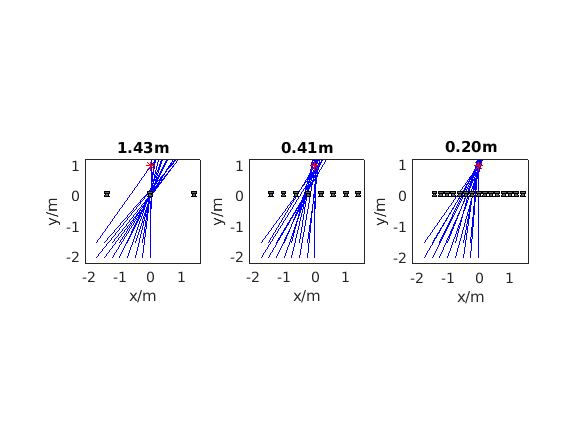
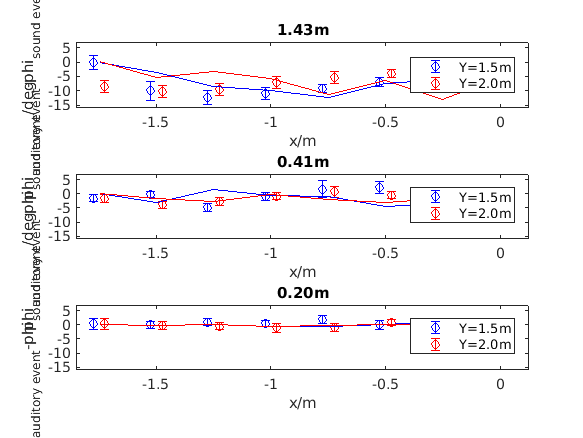
| 'fig7' | Results from a localization experiment for a virtual point source in Wave Field Synthesis for different positions in the listening area (data are the same as in Fig.10). The line is always starting from a listener position and points towards the direction the listener perceived the auditory event. |
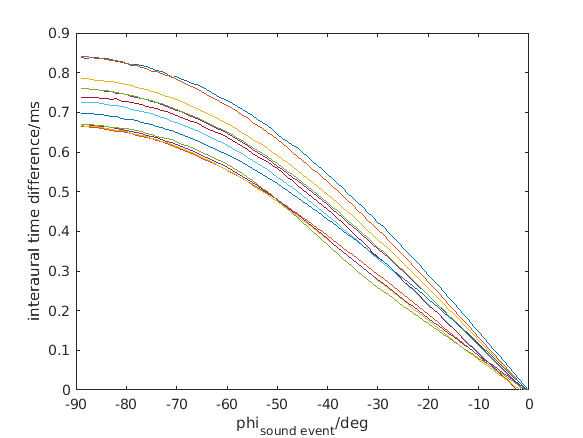
| 'fig8' | Mapping of ITD values in the first twelve frequency channels to the corresponding azimuth angles in the range -90deg to 90deg. The ITD values are calculated from an HRTF data base with the binaural model after Dietz. |
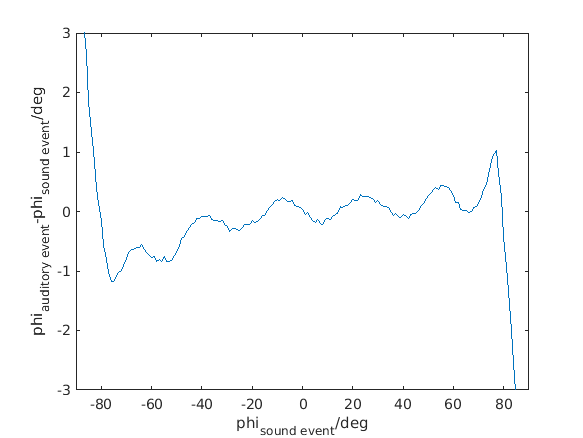
| 'fig9' | Deviation of the predicted sound source location with the mapping function from Fig.8 for the same HRTF data set as in Fig.8. |
| 'fig10' | Results from a localization experiment for a virtual point source in Wave Field Synthesis for different positions in the listening area (data points are the same as in Fig.6). The signals were simulated by binaural synthesis and given also to the Dietz binaural model to predict the localization. The model results are shown as lines. Three different loudspeaker array setups were used. |
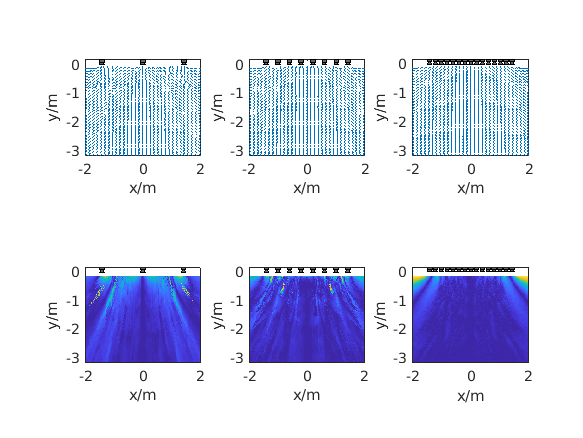
| 'fig11a' | Prediction of the localization for a virtual point source in Wave Field Synthesis in the whole listening area for a linear loudspeaker array. |
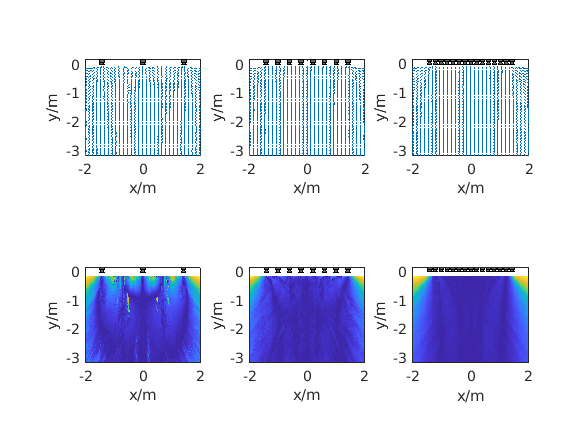
| 'fig11b' | Prediction of the localization for a virtual plane wave in Wave Field Synthesis in the whole listening area for a linear loudspeaker array. |
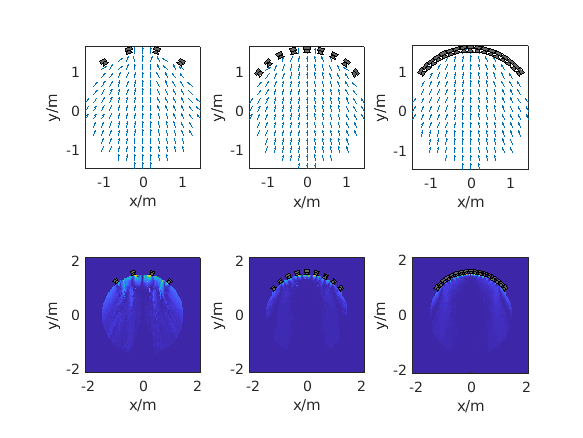
| 'fig12a' | Prediction of the localization for a virtual point source in Wave Field Synthesis in the whole listening area for a circular loudspeaker array. |
| 'fig12b' | Prediction of the localization for a virtual plane wave in Wave Field Synthesis in the whole listening area for a circular loudspeaker array. |
If no flag is given, the function will print the list of valid flags.
Examples:
To display Figure 1 use
exp_wierstorf2013('fig1');
To display Figure 3 use
exp_wierstorf2013('fig3');

To display Figure 6 use
exp_wierstorf2013('fig6');
To display Figure 7 use
exp_wierstorf2013('fig7');
To display Figure 8 use
exp_wierstorf2013('fig8');
To display Figure 9 use
exp_wierstorf2013('fig9');
To display Figure 10 use
exp_wierstorf2013('fig10');
To display Figure 11a use
exp_wierstorf2013('fig11a');
To display Figure 11b use
exp_wierstorf2013('fig11b');
To display Figure 12a use
exp_wierstorf2013('fig12a');
To display Figure 12b use
exp_wierstorf2013('fig12b');

The figures in the Wierstorf et al. (2013) were plotted with gnuplot and SFS revision a8914700a4. The appearance of figures presented here may be different.
References:
H. Wierstorf, A. Raake, and S. Spors. Binaural assessment of multi-channel reproduction. In J. Blauert, editor, The technology of binaural listening, chapter 10. Springer, Berlin--Heidelberg--New York NY, 2013.


Build with Bootstrap