THE AUDITORY MODELING TOOLBOX
This documentation page applies to an outdated AMT version (1.2.0). Click here for the most recent page.
EXP_mckenzie2022 - experiments from McKenzie et al
Usage
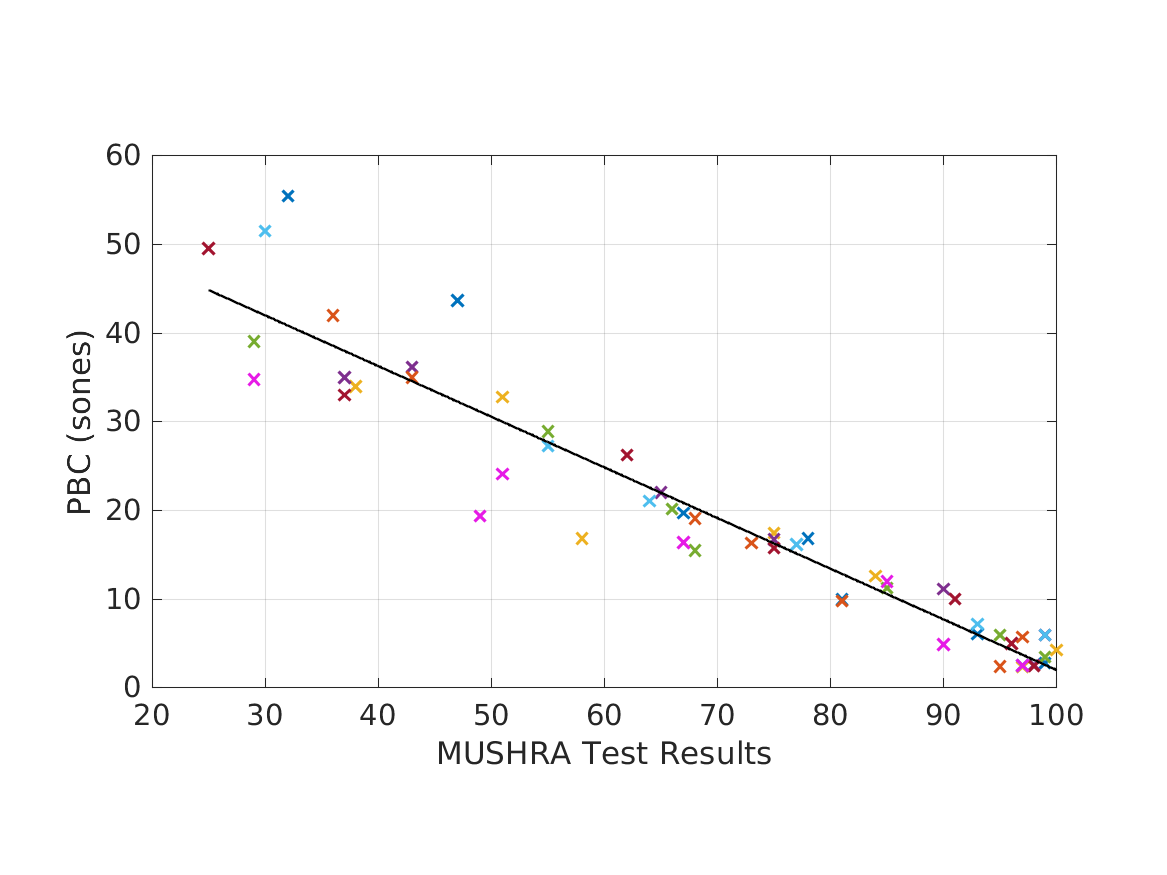
exp_mckenzie2022('fig11d'); % (to plot Figure 11 d).
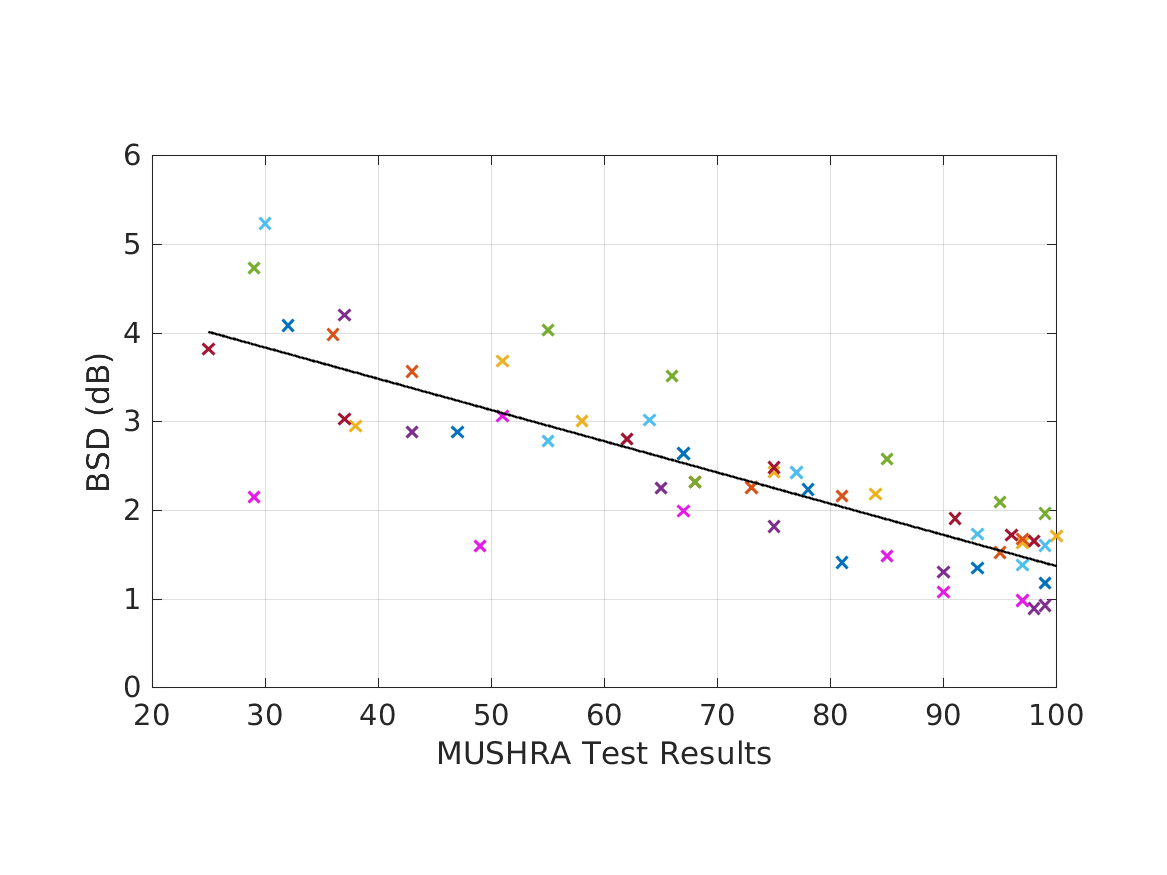
exp_mckenzie2022('fig11a'); % (to plot Figure 11 a).
Description
Reproduces the plots in the listening test section (Figure 11a-d) McKenzie, T.; Armstrong, C.; Ward, L.; Murphy, D.T.; Kearney, G. "Predicting the Colouration between Binaural Signals". Appl. Sci. 2022, 12(2441). https://doi.org/10.3390/app12052441
PEAQ and CLL are commented out in this script so that it runs without any additional files necessary. To produce the respective data, download the PEAQ and CLL code: https://github.com/NikolajAndersson/PEAQ and www.acoustics.hut.fi/-301ville/software/auditorymodel/. The test sounds (ts.... etc) must be saved as wav files to work with the PEAQ model.
Examples:
To display Figure 11a use
exp_mckenzie2022('fig11a');
This code produces the following output:
BSD correlation=-0.83246, p=1.832e-15
To display Figure 11d use
exp_mckenzie2022('fig11d');
This code produces the following output:
PBC correlation=-0.95281, p=1.2461e-29


Build with Bootstrap