THE AUDITORY MODELING TOOLBOX
This documentation page applies to an outdated AMT version (1.3.0). Click here for the most recent page.
Go to function
DATA_ROENNE2012 - Unitary response
Usage
ur = data_roenne2012()
Description
[ur,fs]=data_roenne2012 returns the unitary response from Roenne (2012) and its sampling frequency, \(fs=30000\).
Examples:
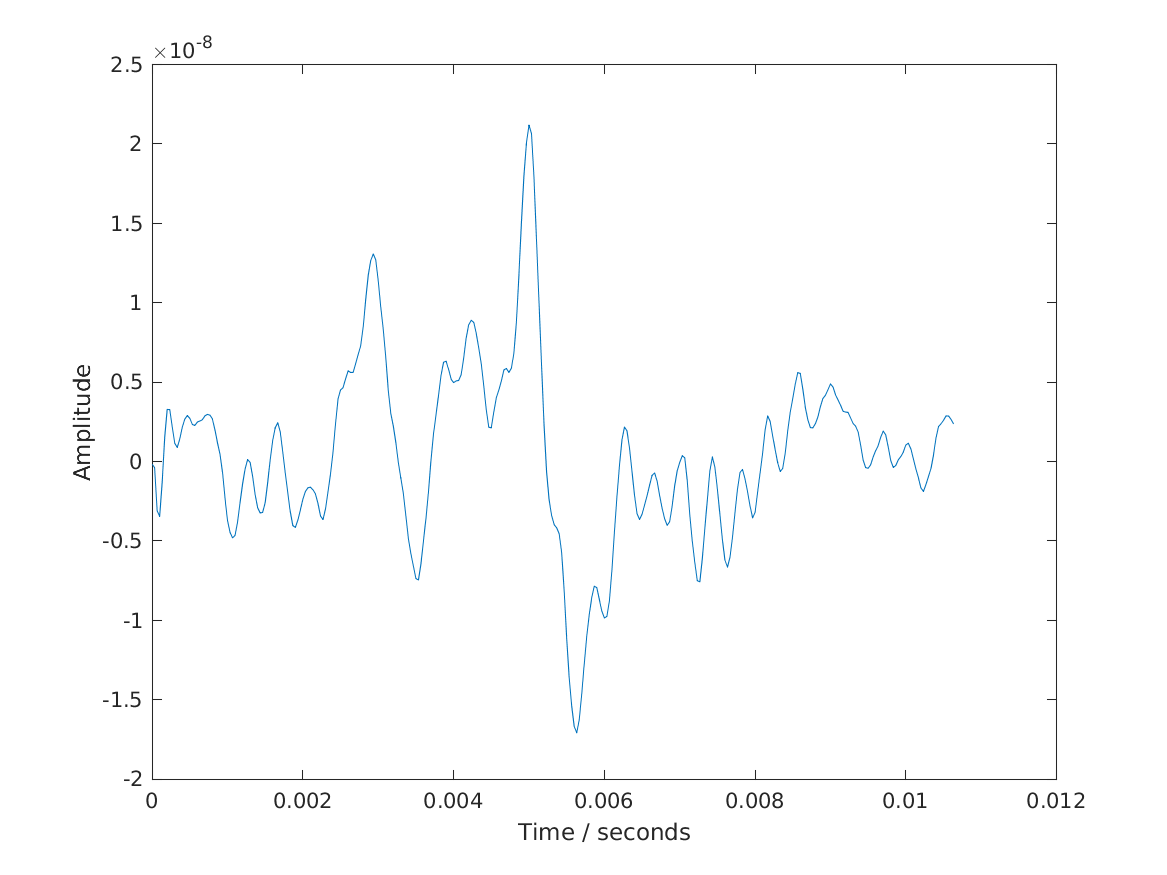
The first plot shows the unitary response in the time-domain:
[ur,fs]  = data_roenne2012;
plot((0:length(ur)-1)/fs,ur);
xlabel('Time / seconds');
ylabel('Amplitude');

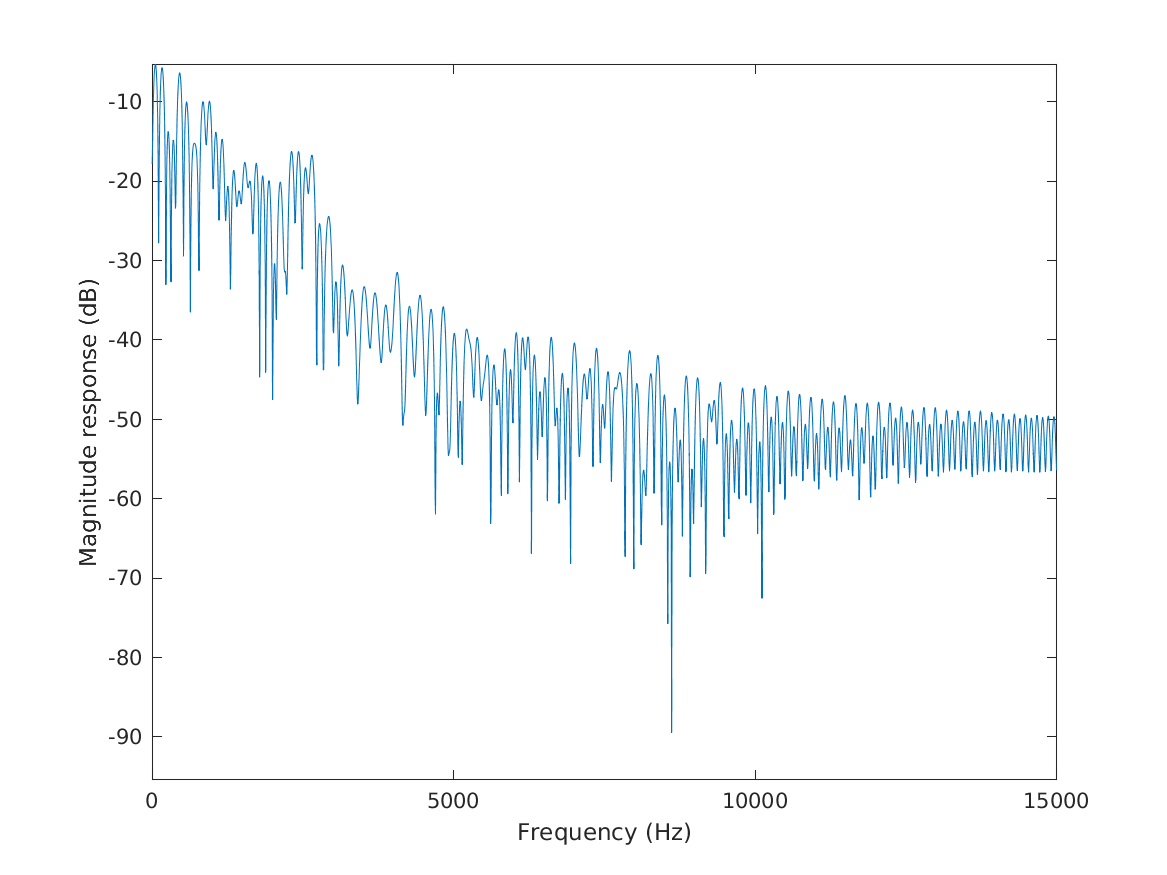
The second plot shows the magnitude response of the unitary response, normalized so the highest peak reaches 0-dB:
[ur,fs]  = data_roenne2012;
magresp(ur,fs,90,'fir','1');

References:
F. M. Rønne, T. Dau, J. Harte, and C. Elberling. Modeling auditory evoked brainstem responses to transient stimuli. The Journal of the Acoustical Society of America, 131(5):3903--3913, 2012. [ DOI | http ]


