THE AUDITORY MODELING TOOLBOX
This documentation page applies to an outdated AMT version (1.3.0). Click here for the most recent page.
EXP_OSSES2022 - comparison of eight monaural models
Usage
data = exp_osses2022(flags)
data = exp_osses2022(..., 'models', models)
Description
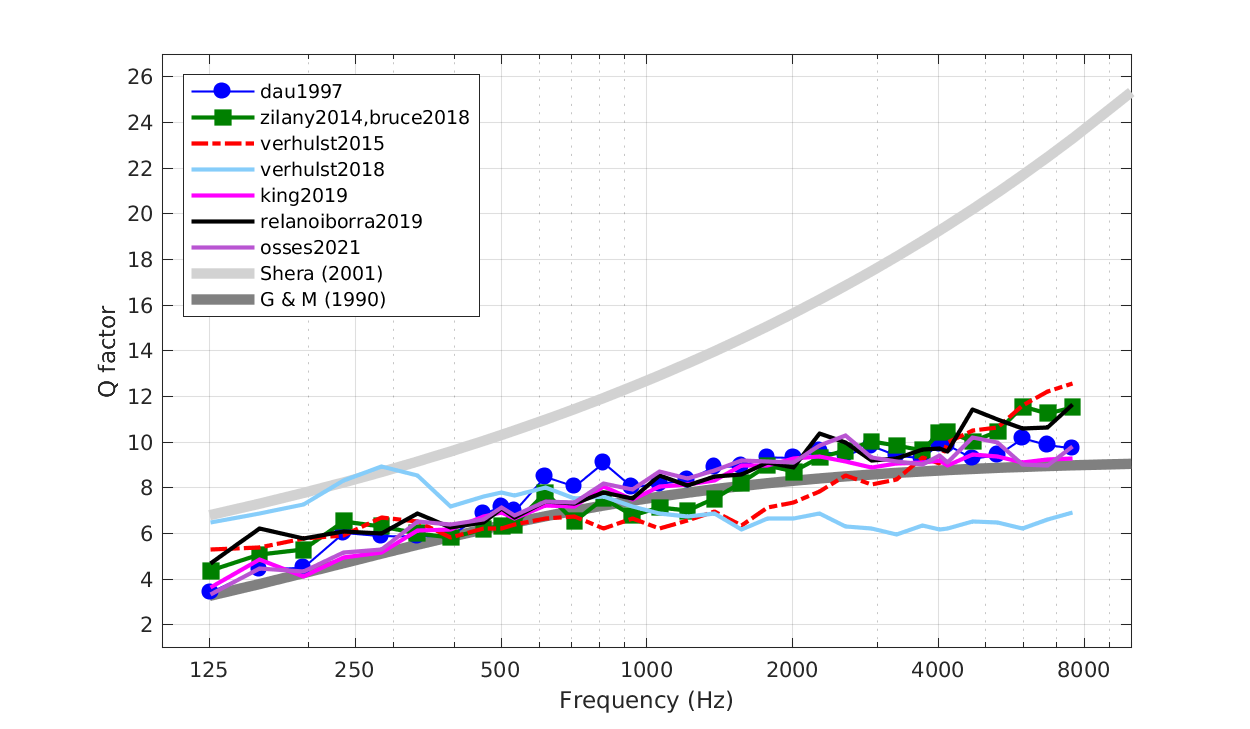
exp_osses2022 reproduces the figures from Osses et al. (2022), where the following models are compared:
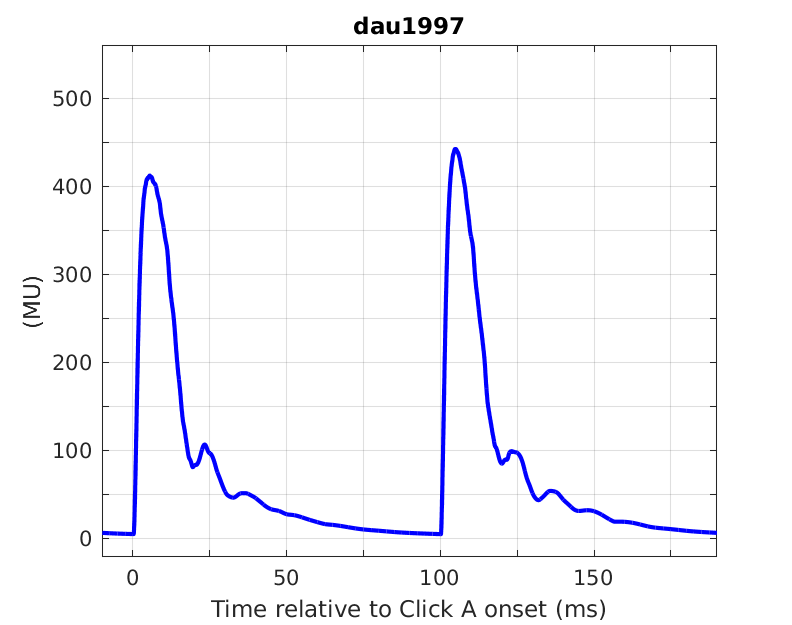
| 'dau1997' | : Model #1 from Dau et al., (1997) |
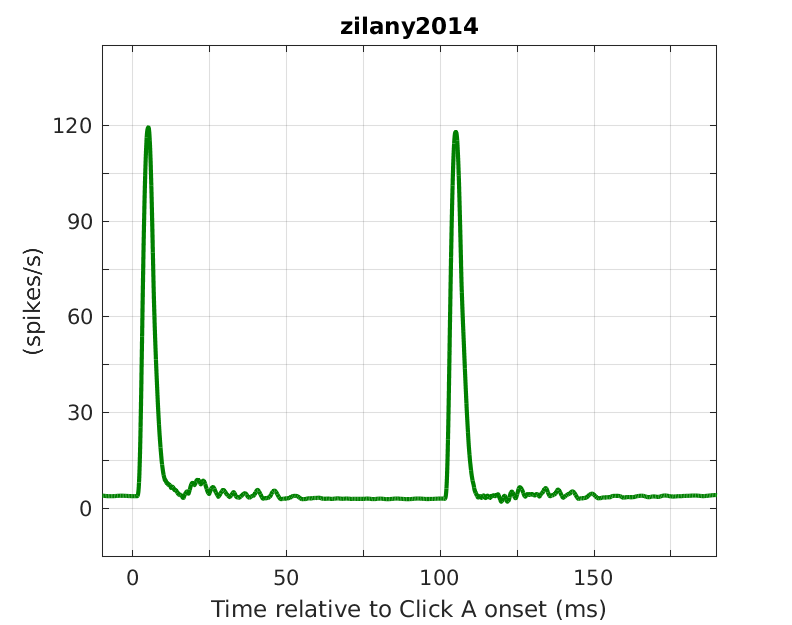
| 'zilany2014' | : Model #2 from Zilany et al., (2014) |
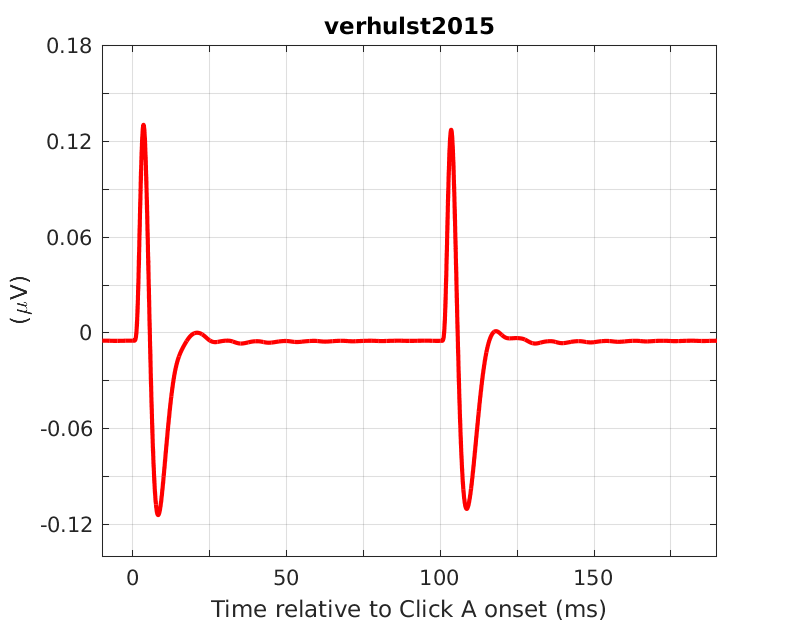
| 'verhulst2015' | : Model #3 from Verhulst et al., (2015) |
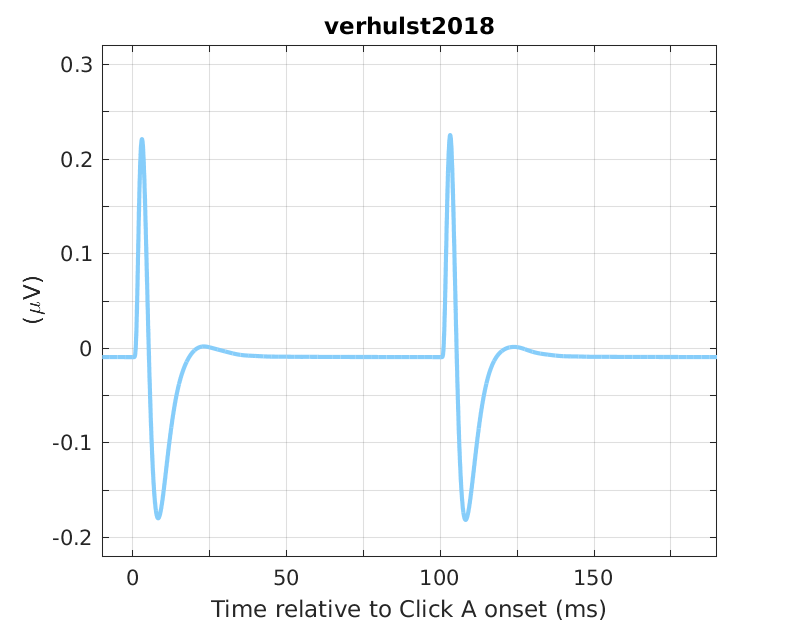
| 'verhulst2018' | : Model #4 from Verhulst et al., (2018) |
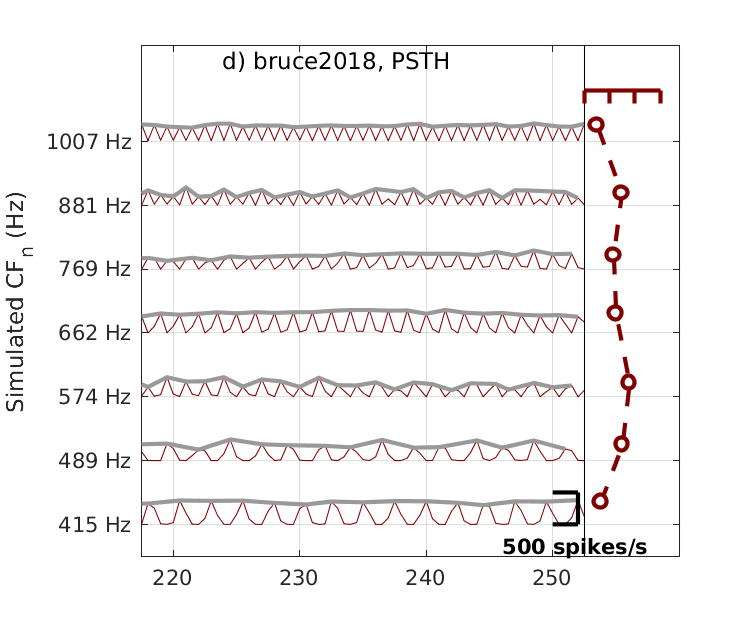
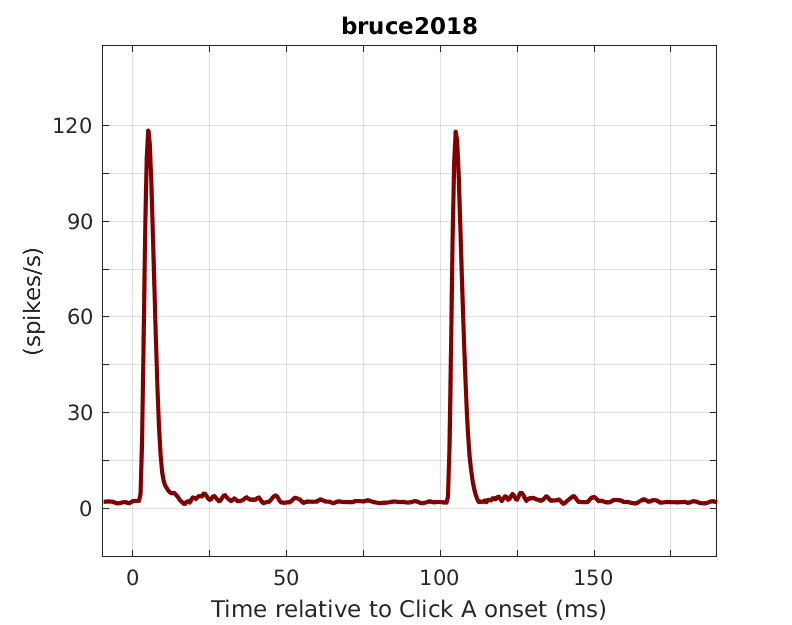
| 'bruce2018' | : Model #5 from Bruce et al., (2018) |
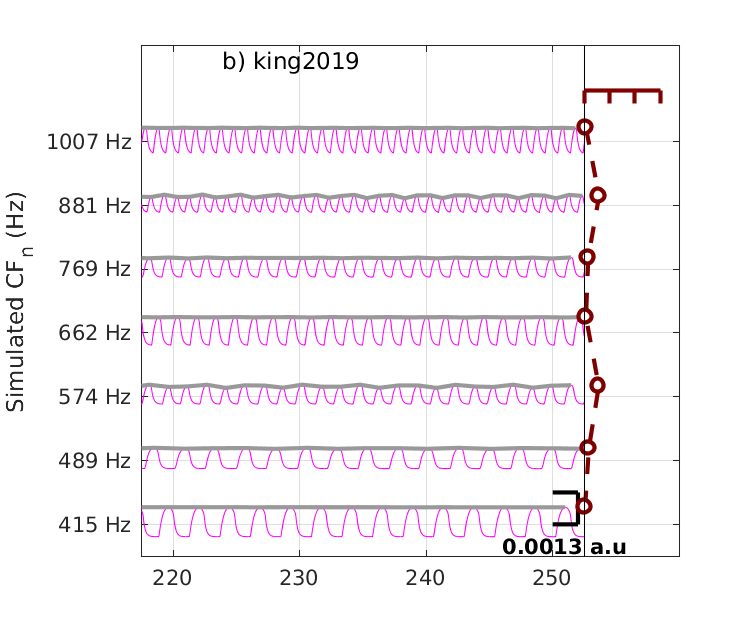
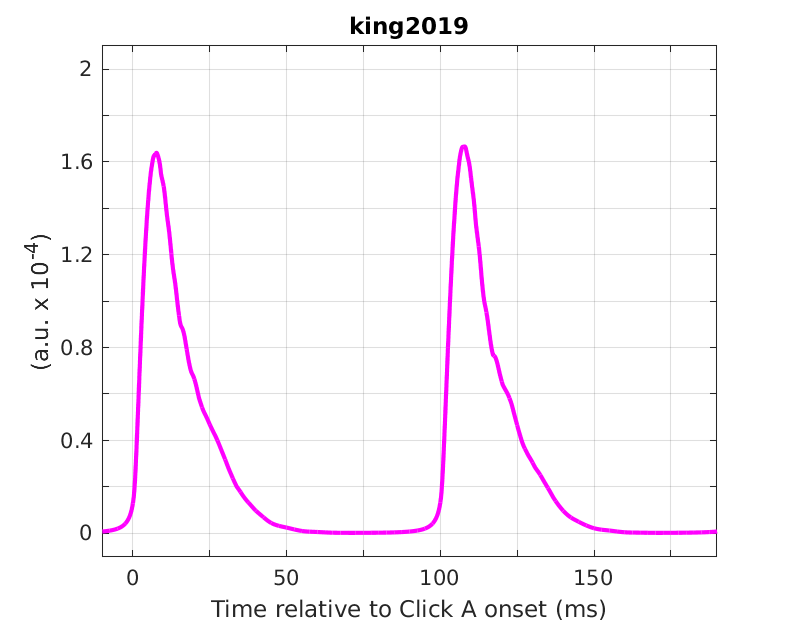
| 'king2019' | : Model #6 from King et al., (2019) |
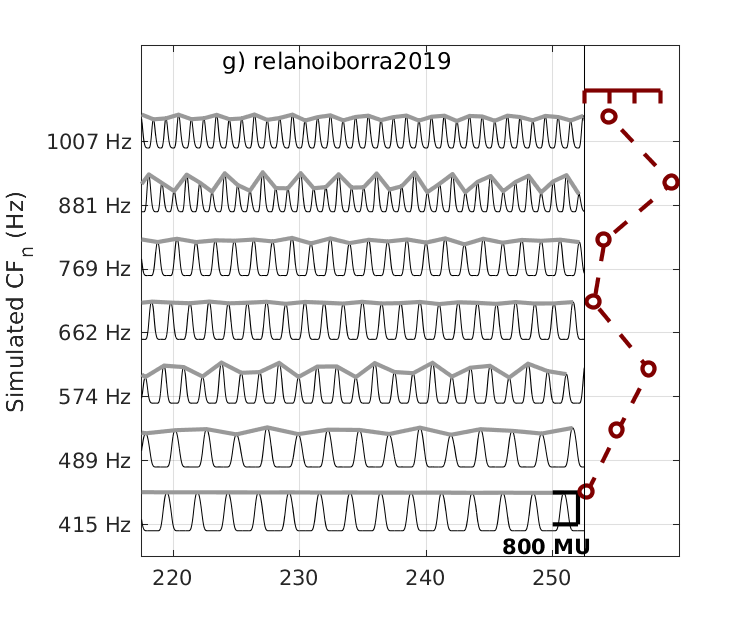
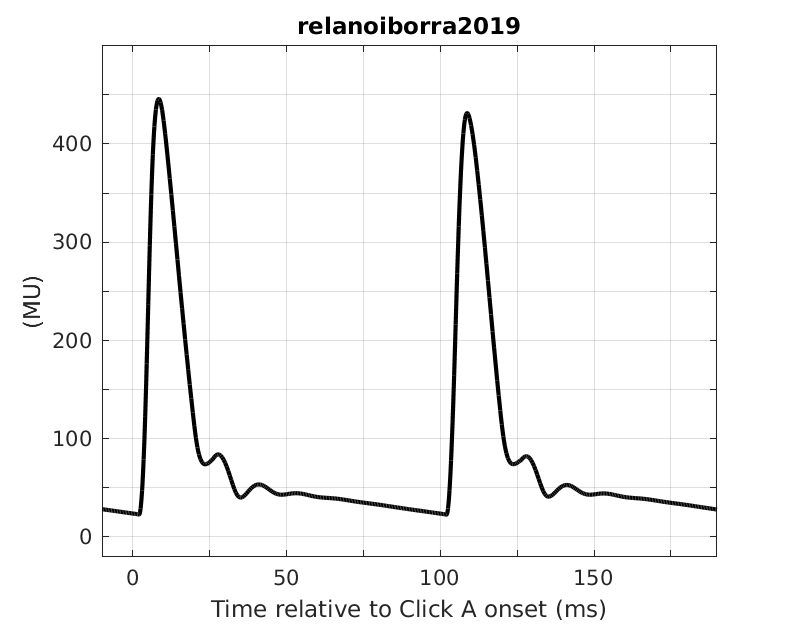
| 'relanoiborra2019' | : Model #7 from Relano-Iborra et al., (2019) |
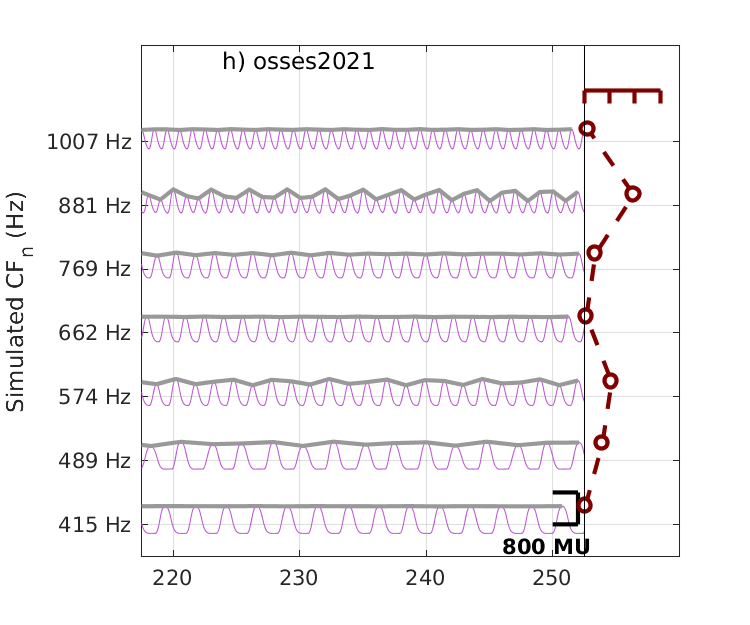
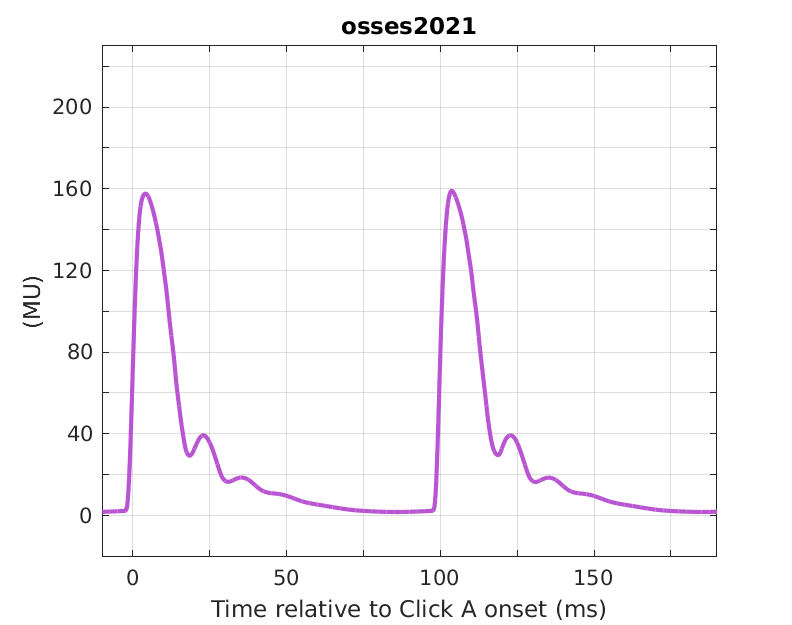
| 'osses2021' | : Model #8 from Osses and Kohlrausch (2021) |
The following flags can be specified;
| 'redo' | Recomputes data for specified figure |
| 'plot' | Plot the output of the experiment. This is the default. |
| 'no_plot' | Doesn't plot, only return data. |
| 'models' | Vector selecting the models, if not all models to process. For example 'models',[1 3 6] shows the data for Dau et al., (1997), Verhulst et al., (2015), and King et al., (2019) only. |
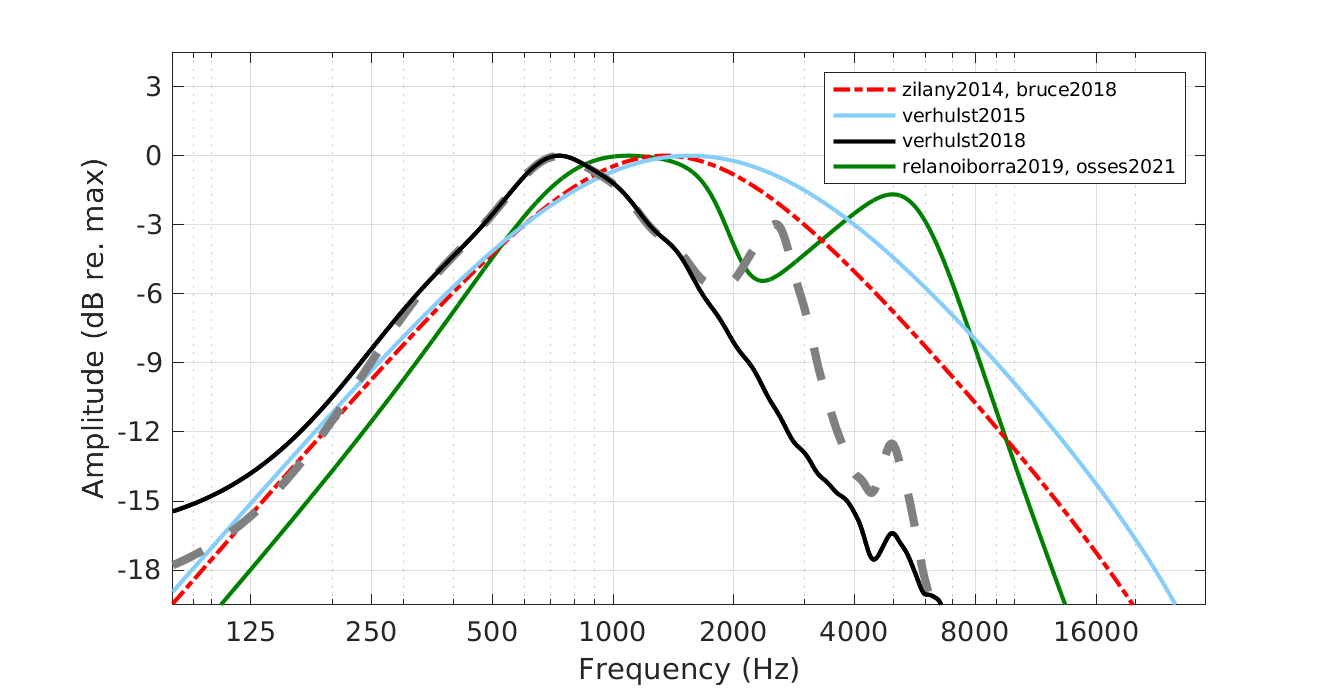
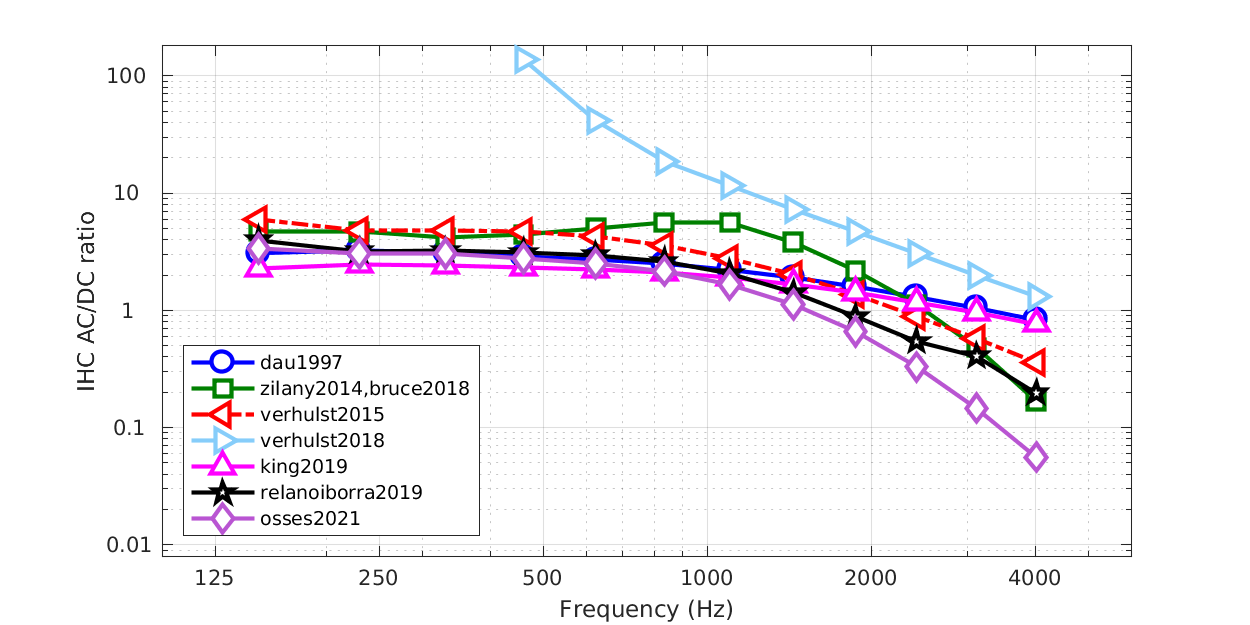
To display Fig. 3 of Osses et al., (2022) use
out = exp_osses2022('fig3');
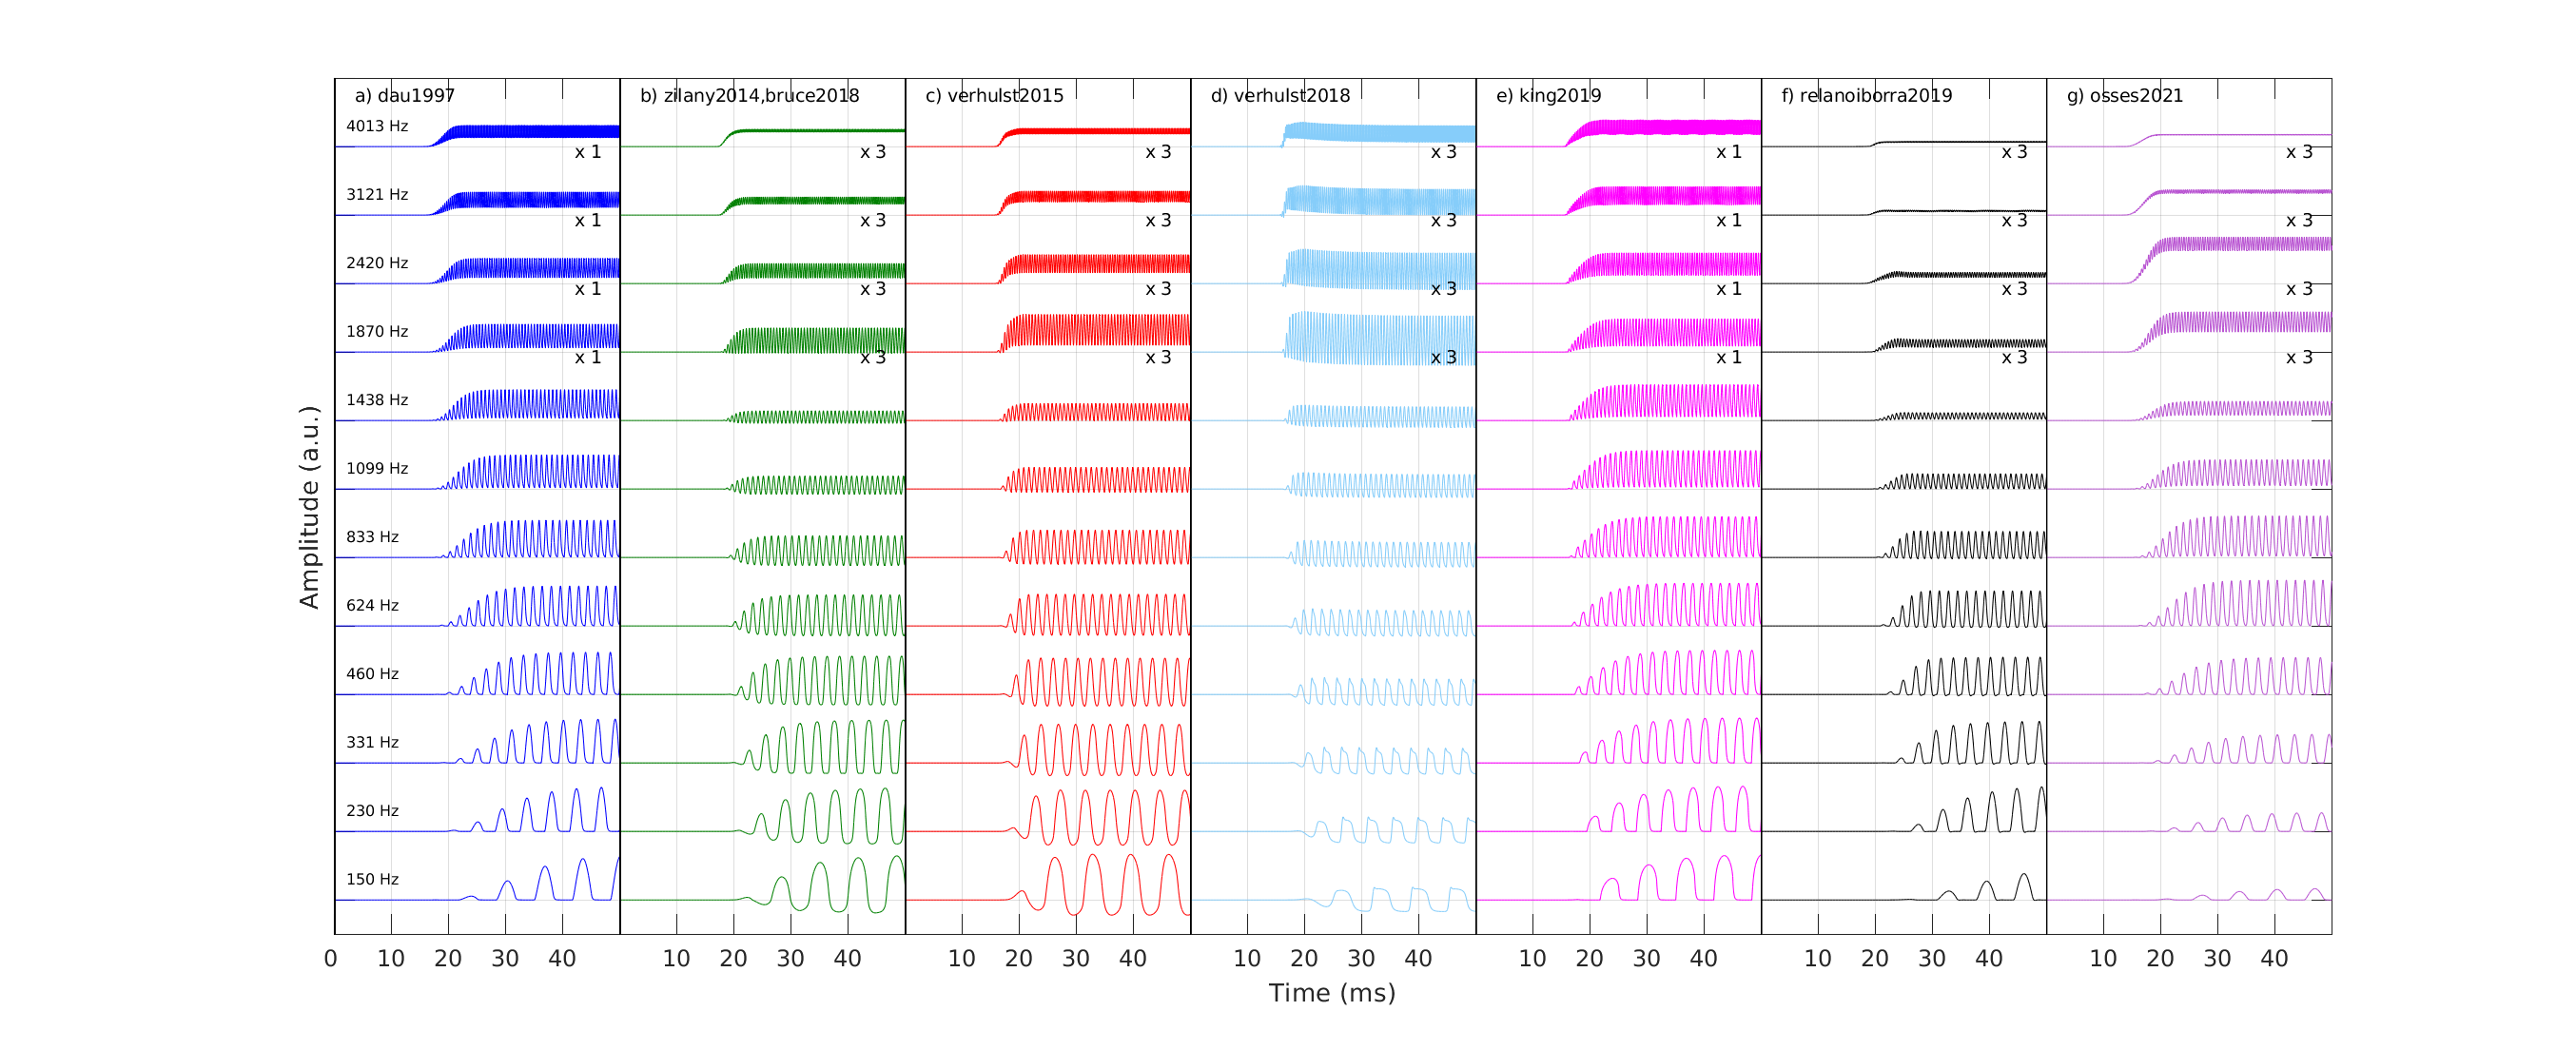
To display Fig. 4 of Osses et al., (2022) use
out = exp_osses2022('fig4');
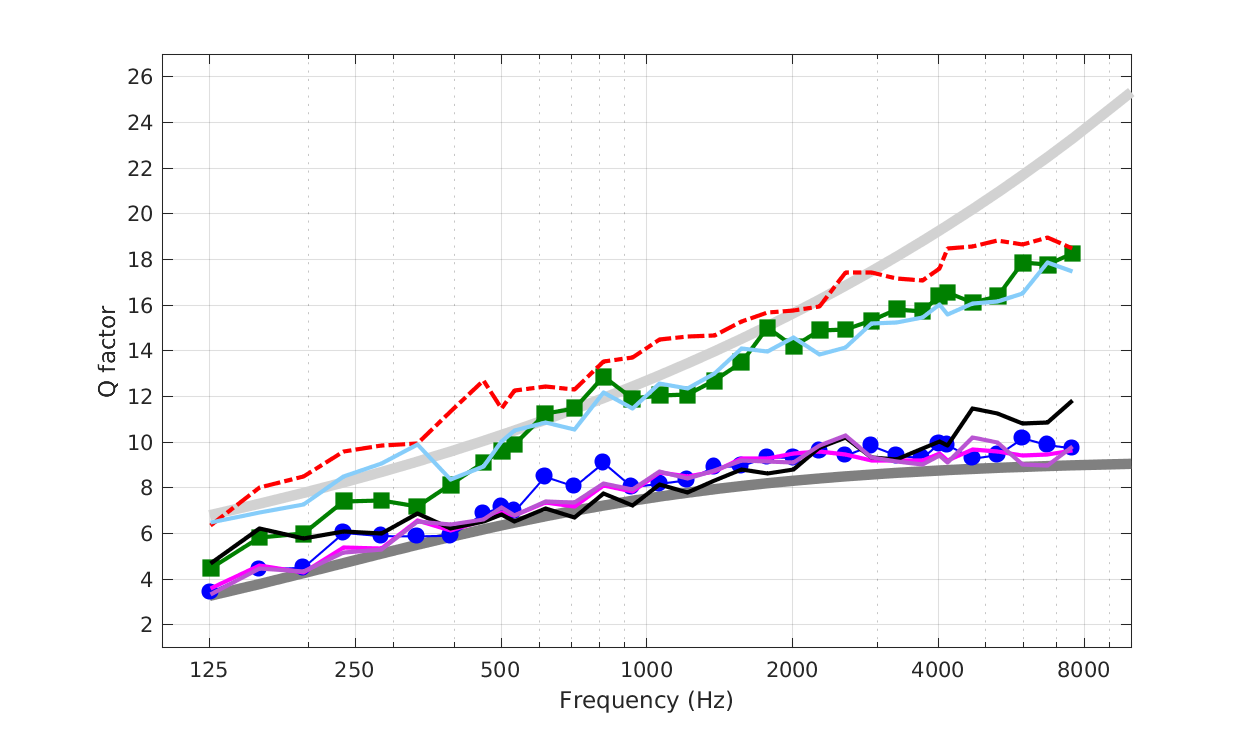
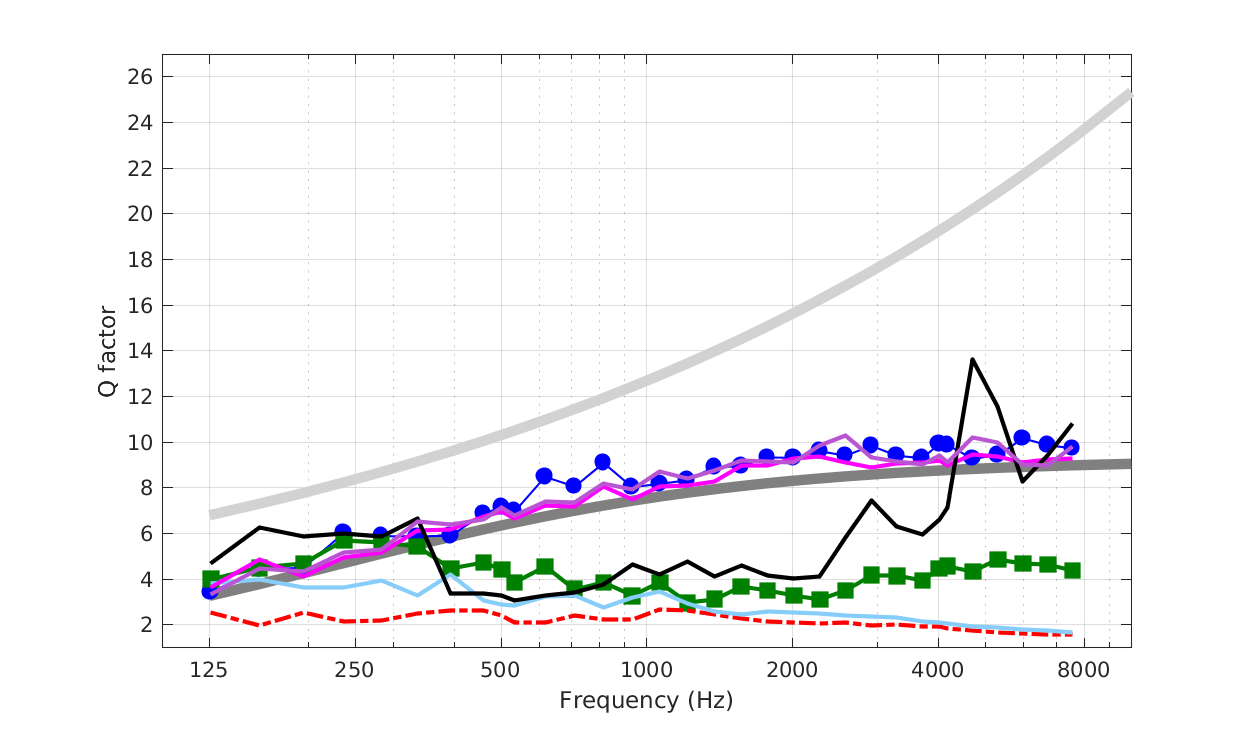
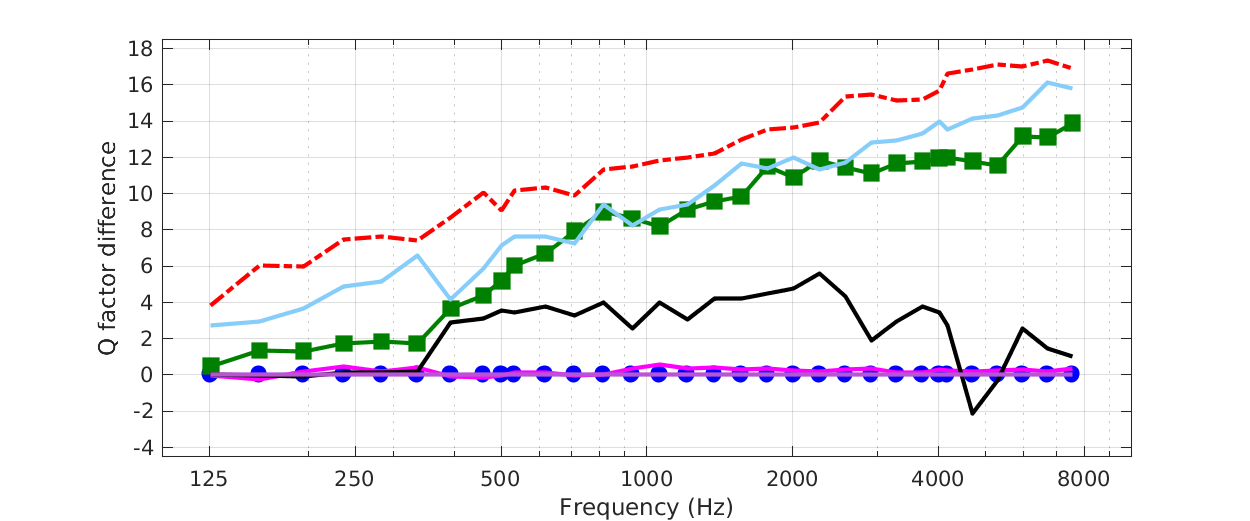
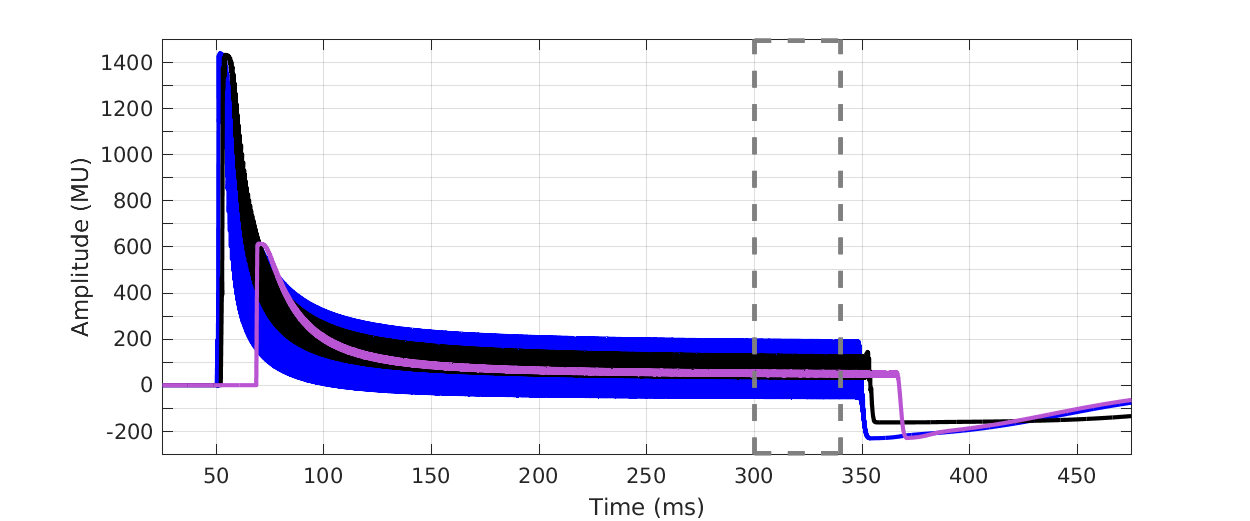
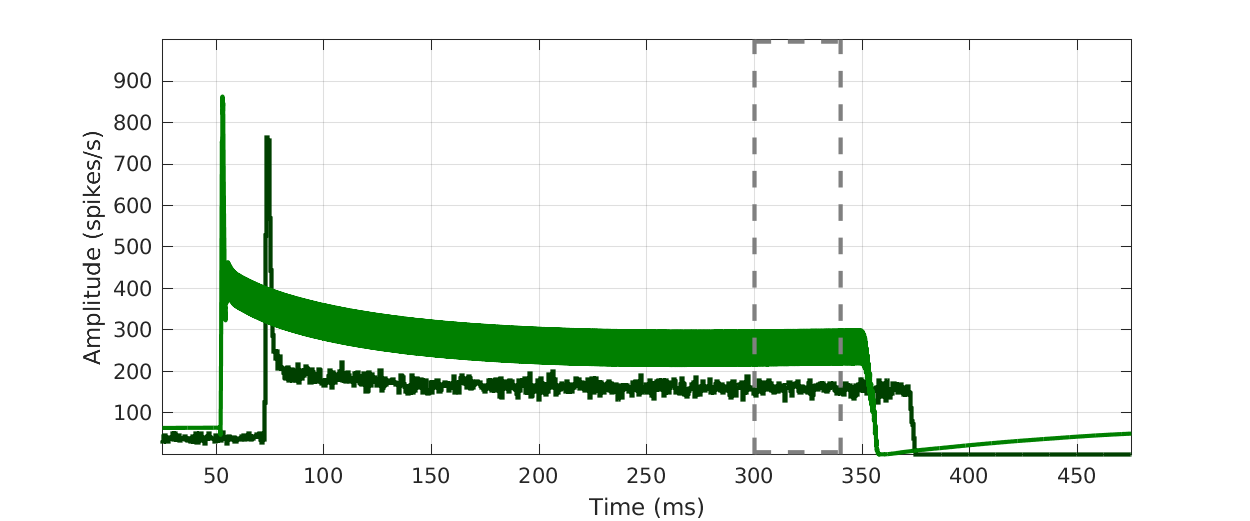
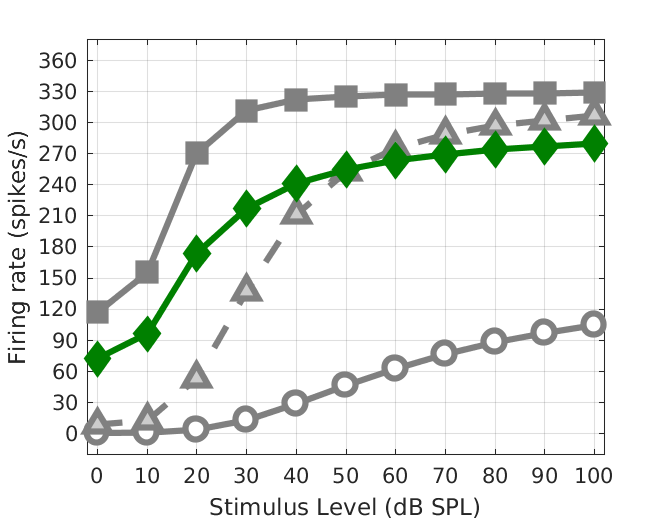
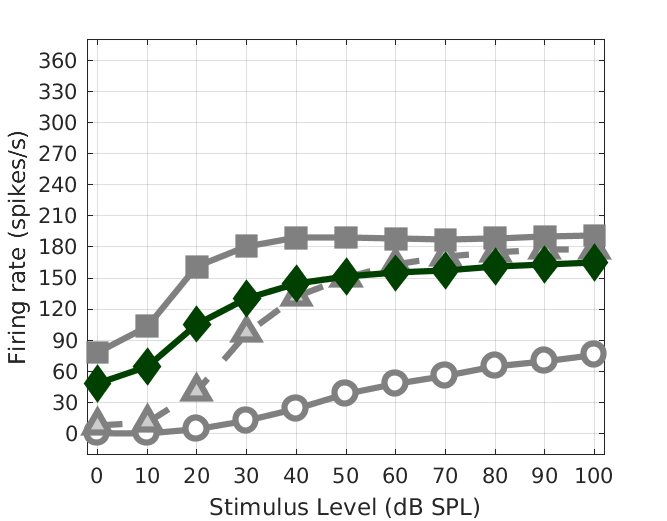
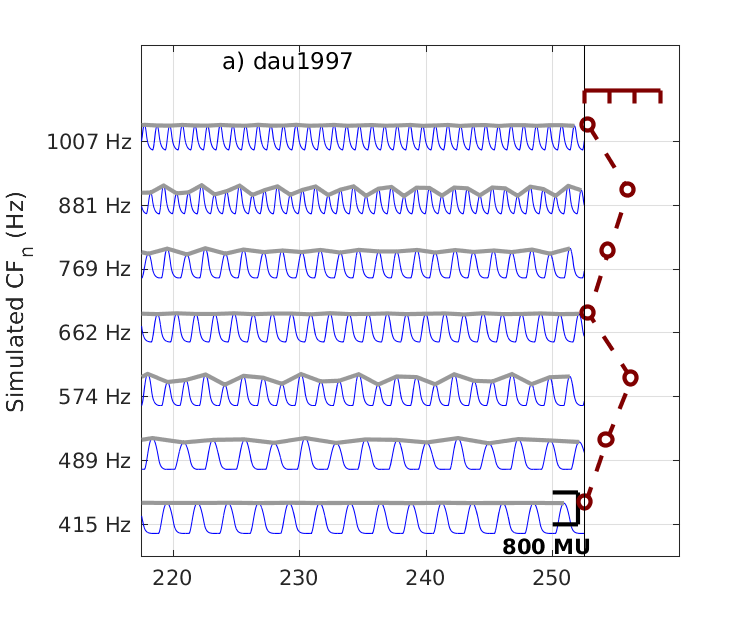
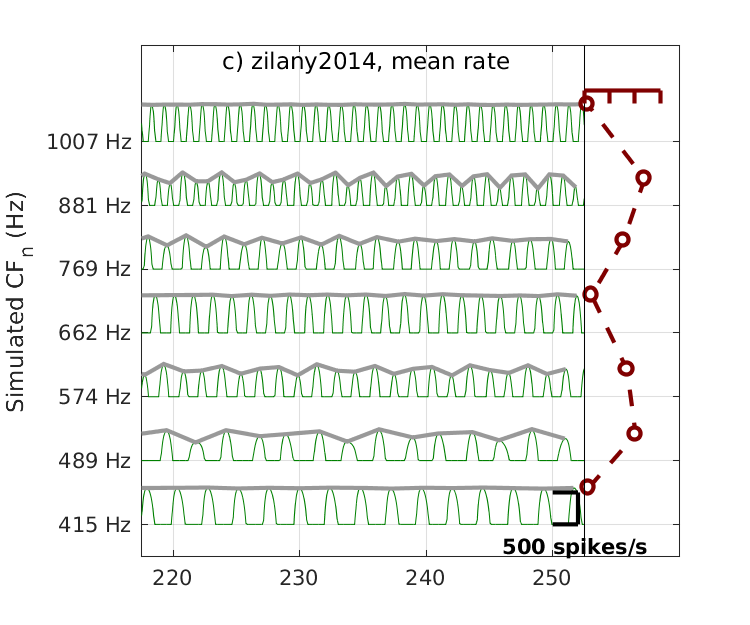
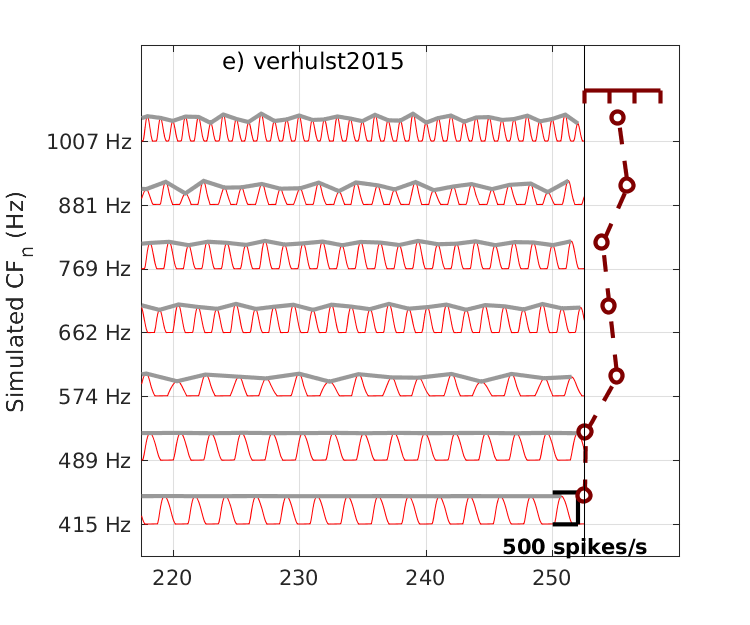
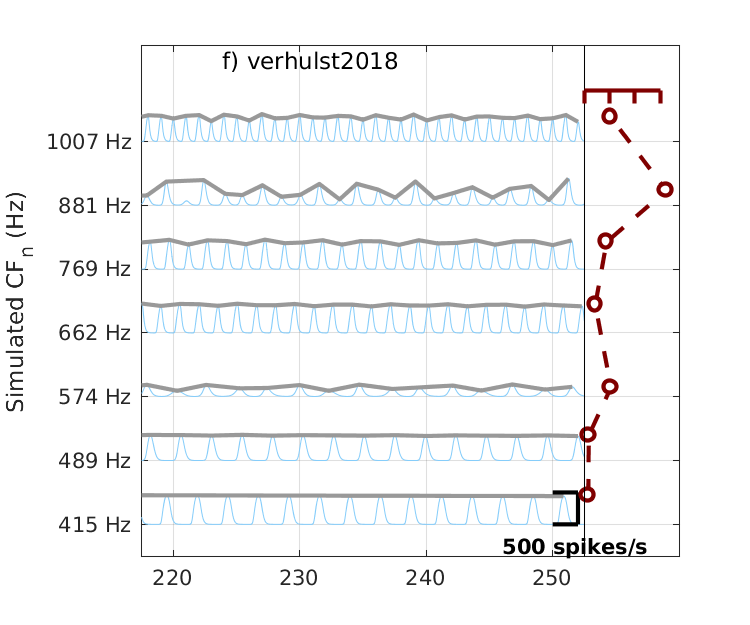
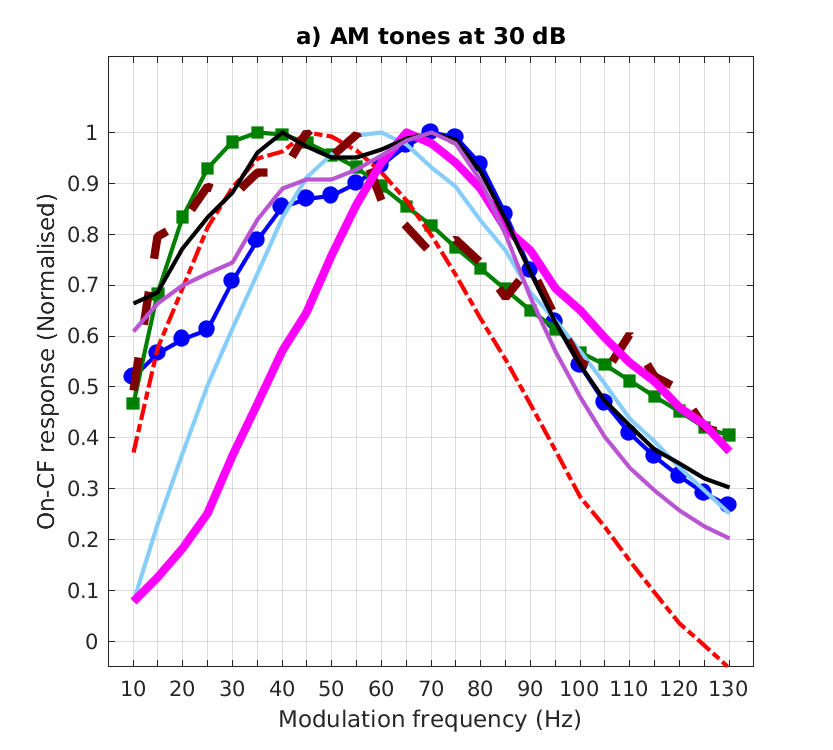
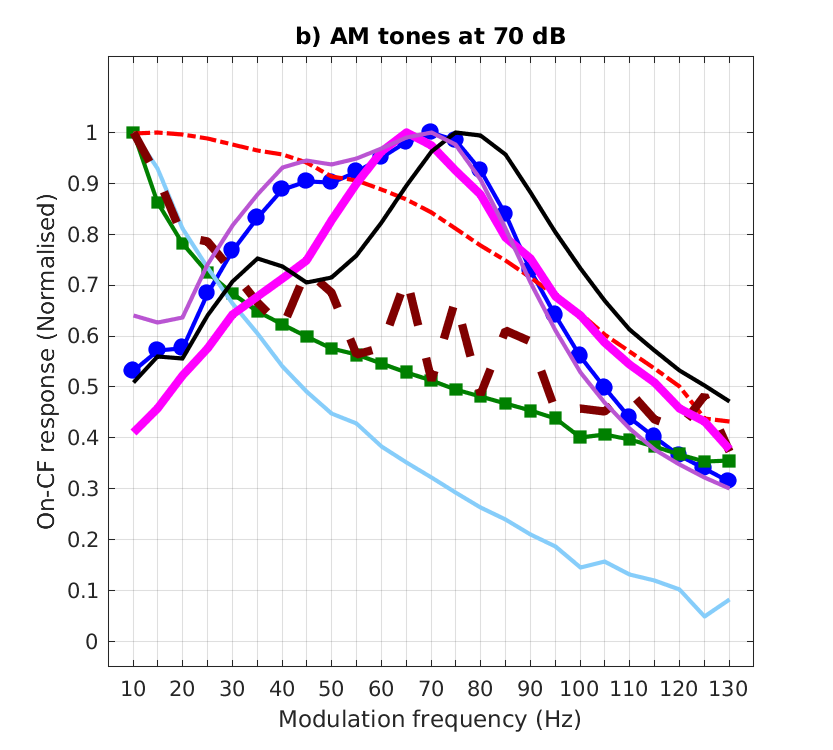
To display Fig. 5 of Osses et al., (2022) use
out = exp_osses2022('fig5');
To display Fig. 6 of Osses et al., (2022) use
out = exp_osses2022('fig6');
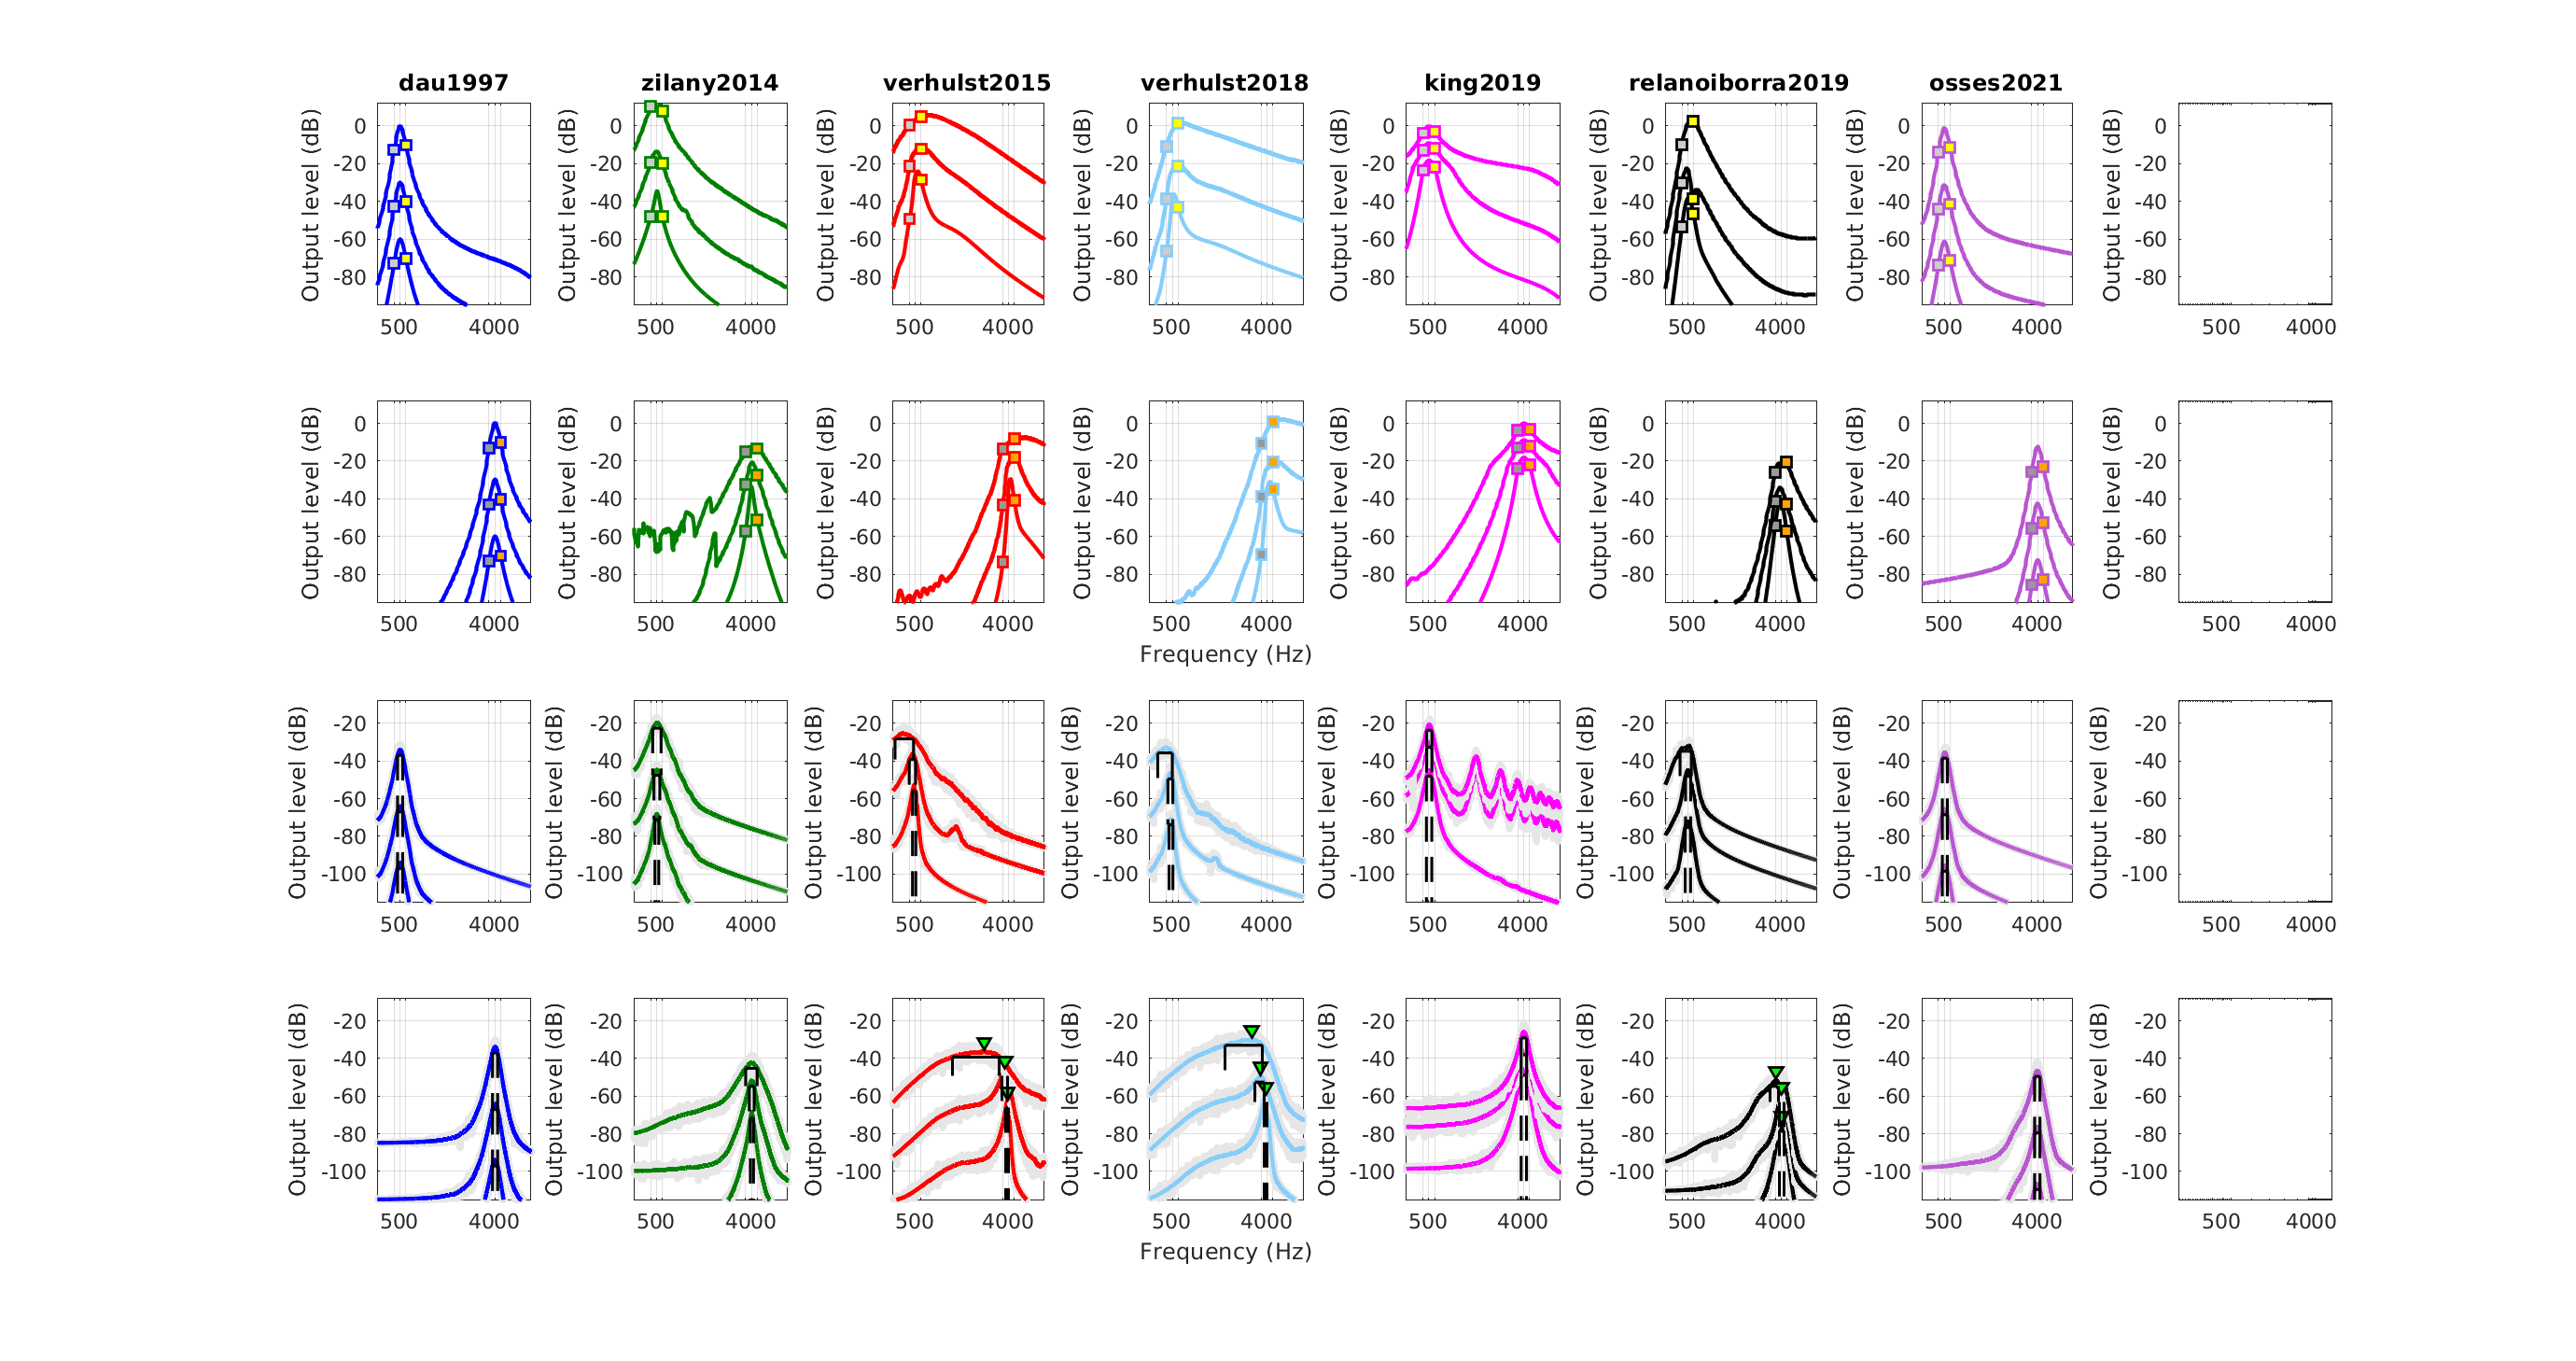
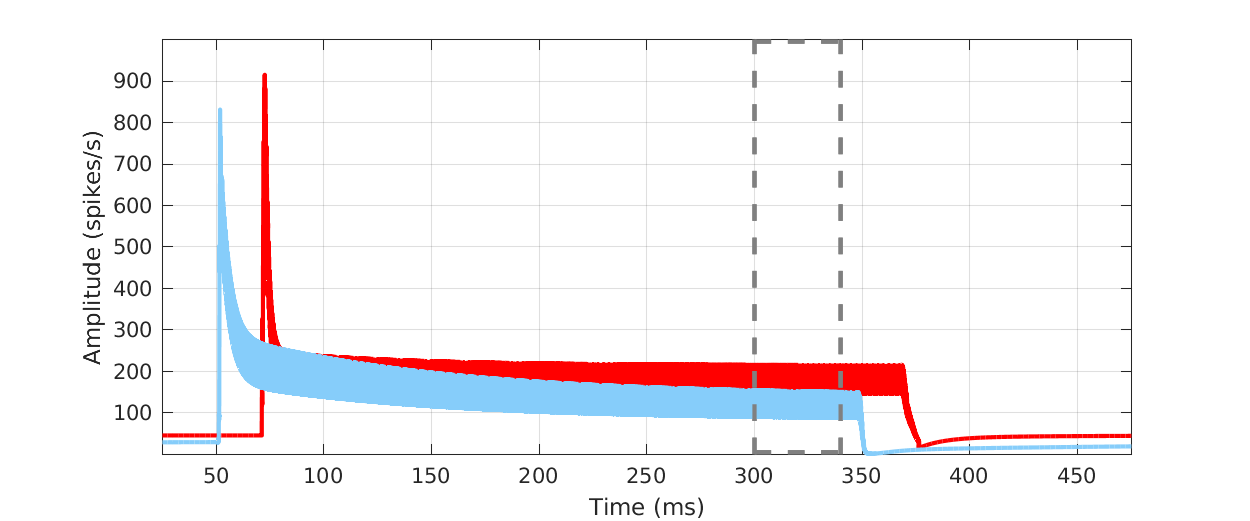
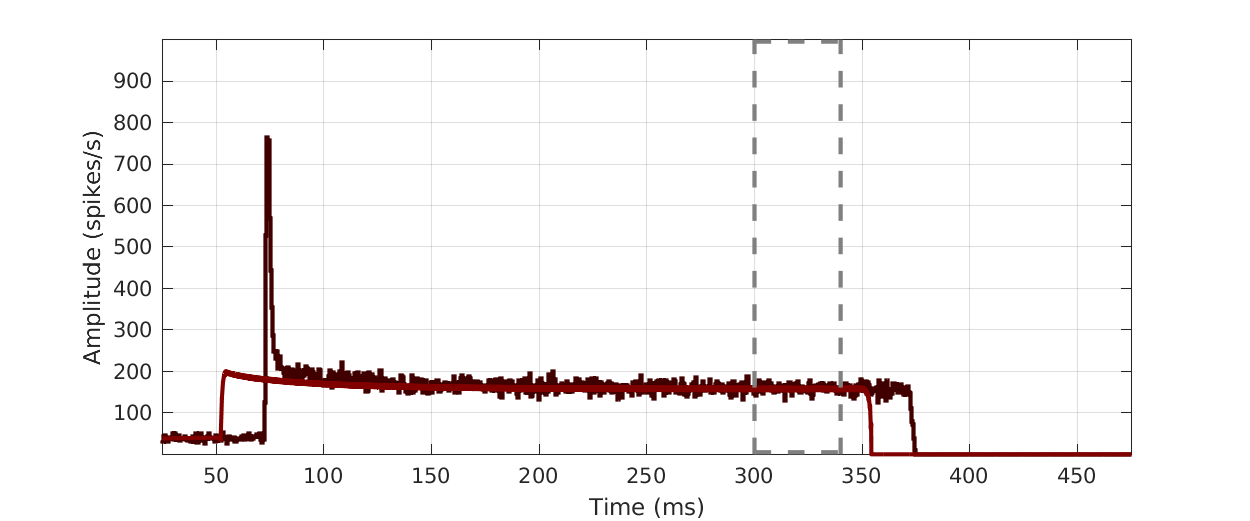
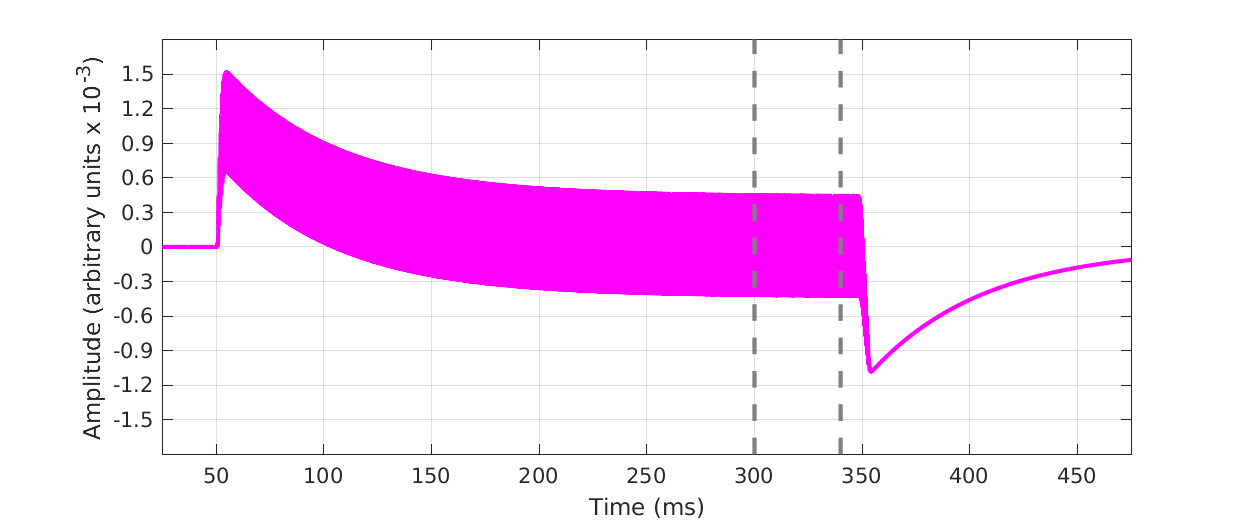
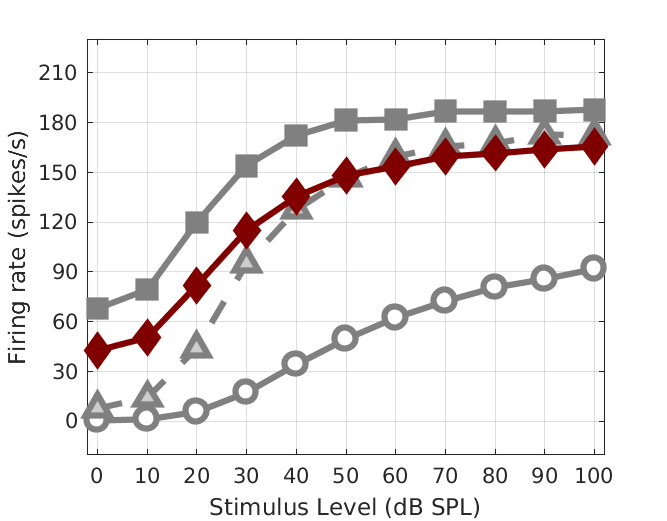
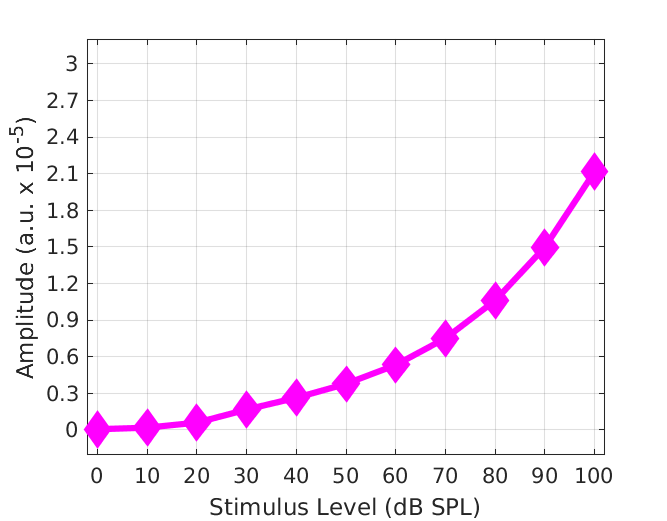
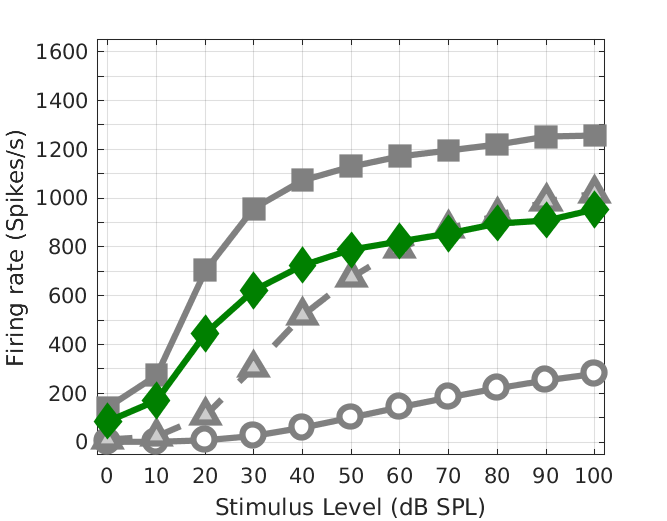
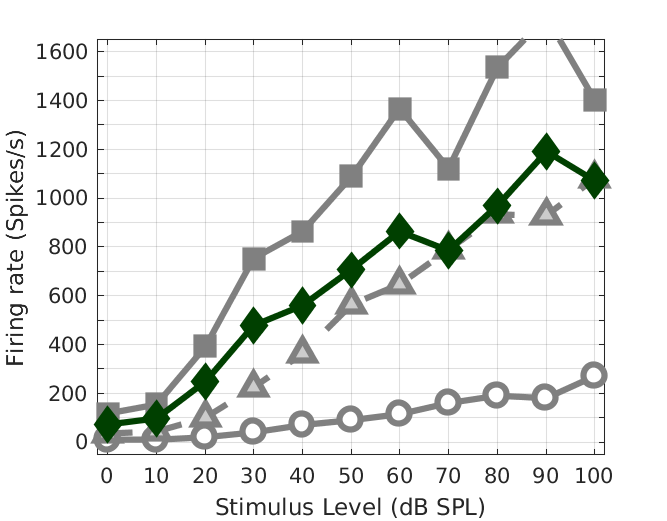
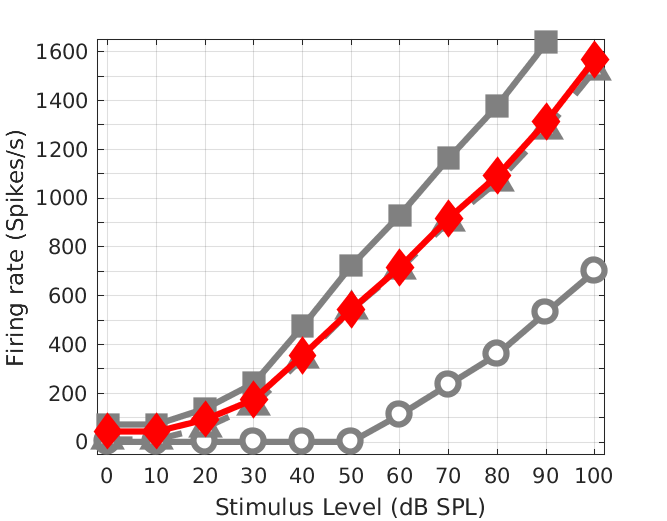
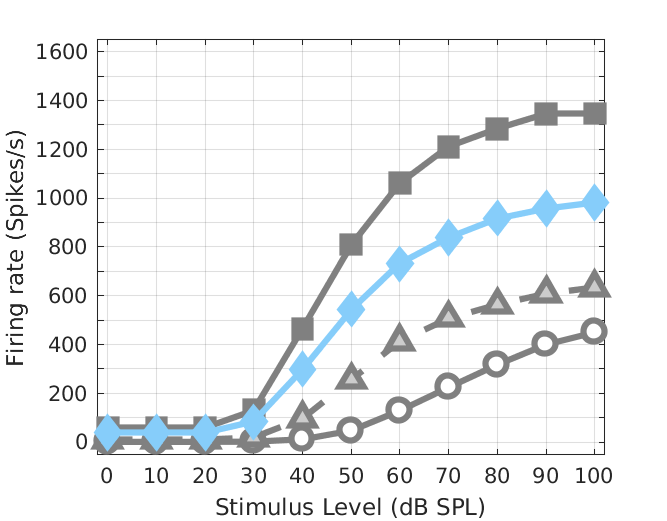
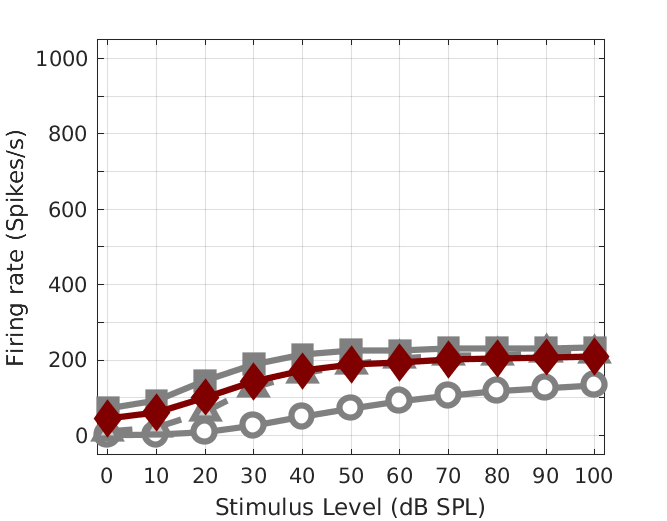
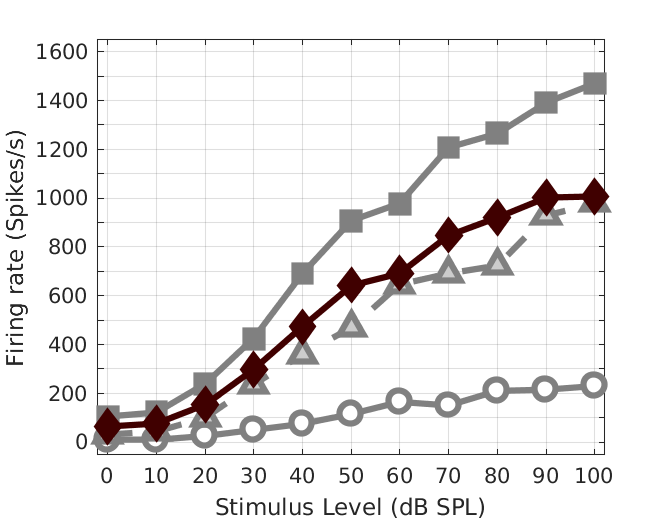
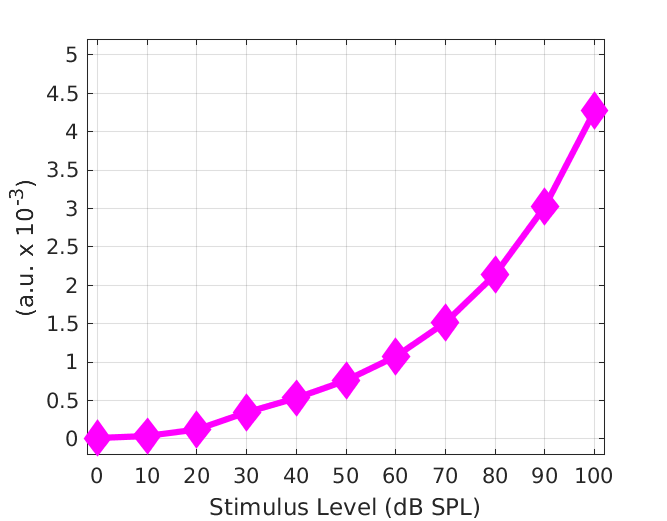
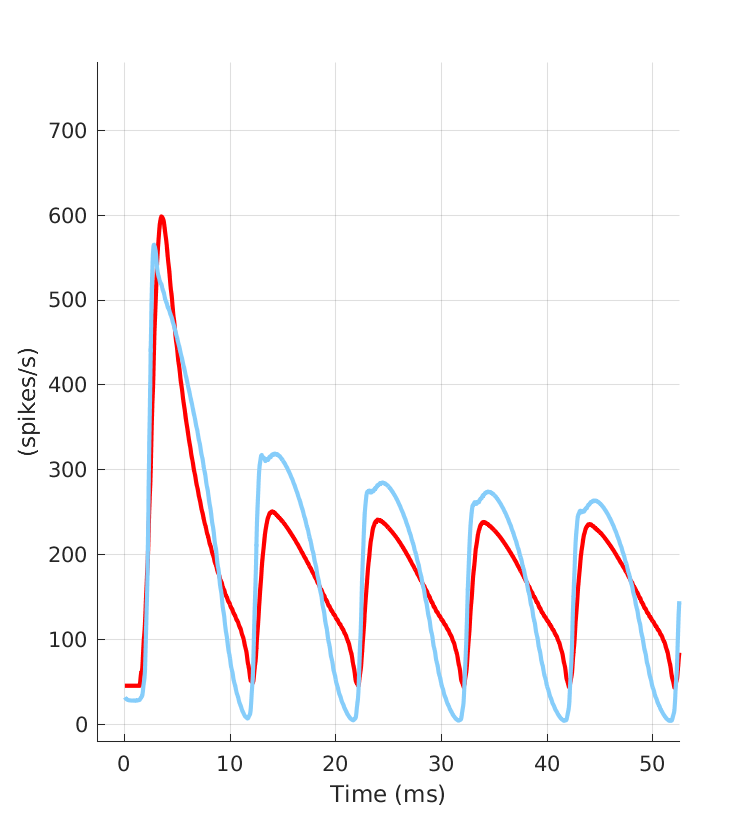
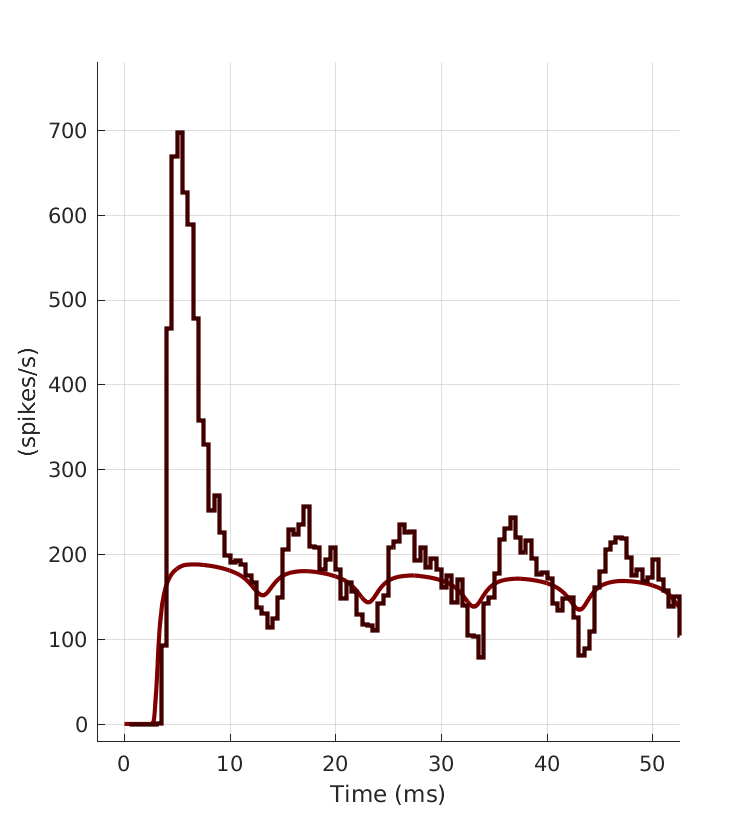
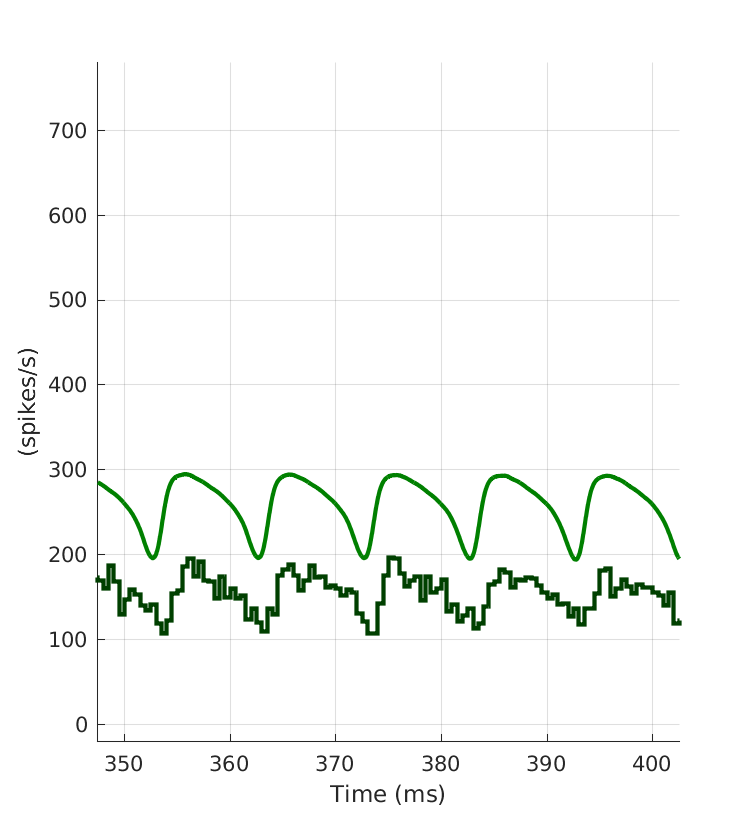
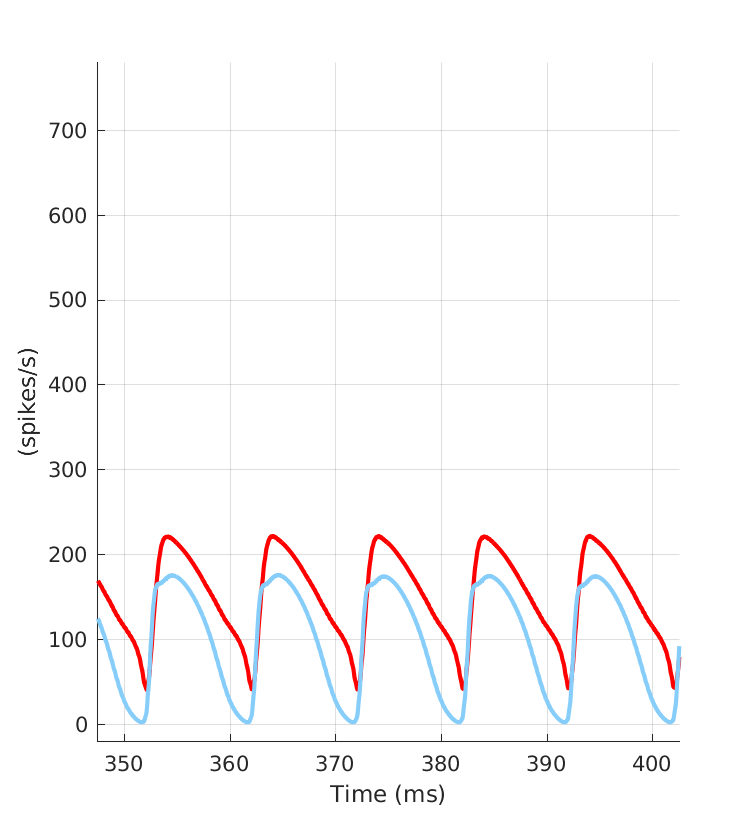
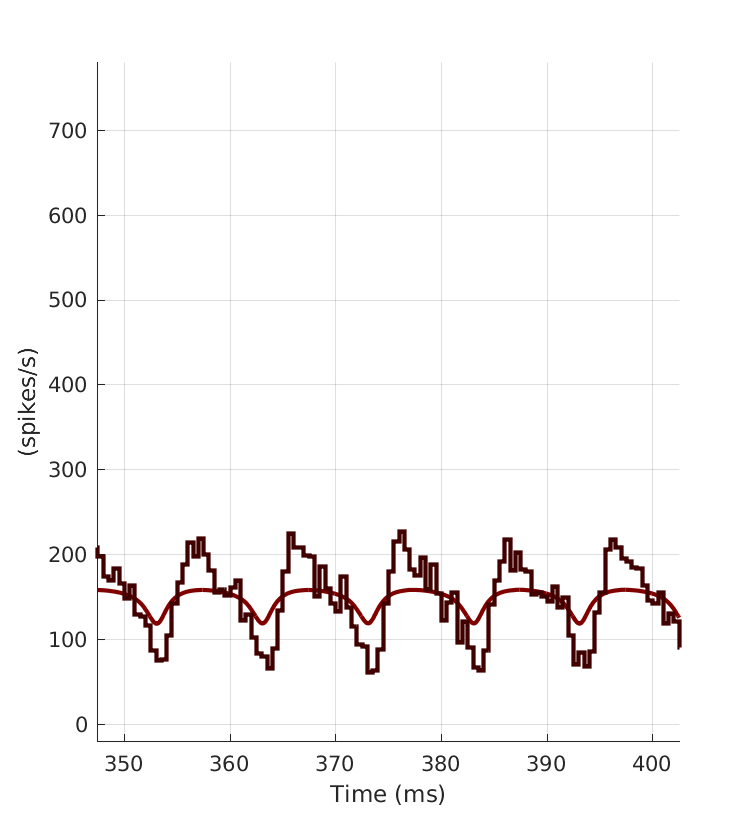
This code produces the following output:
Using Q03
Using Q03
Using Q03
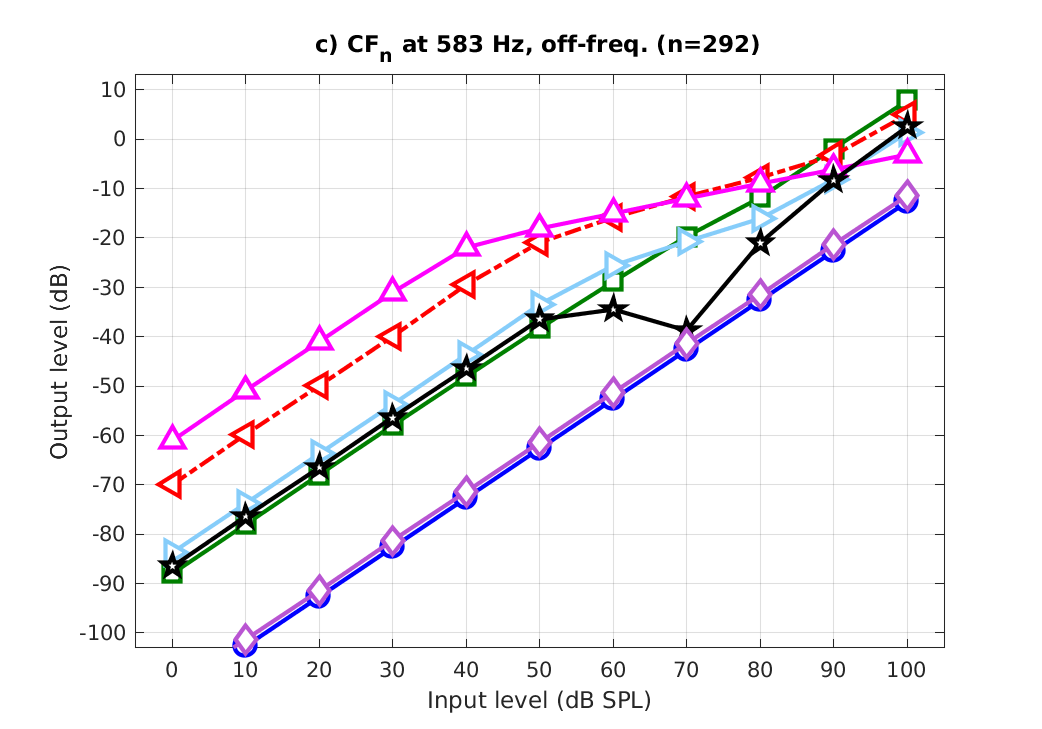
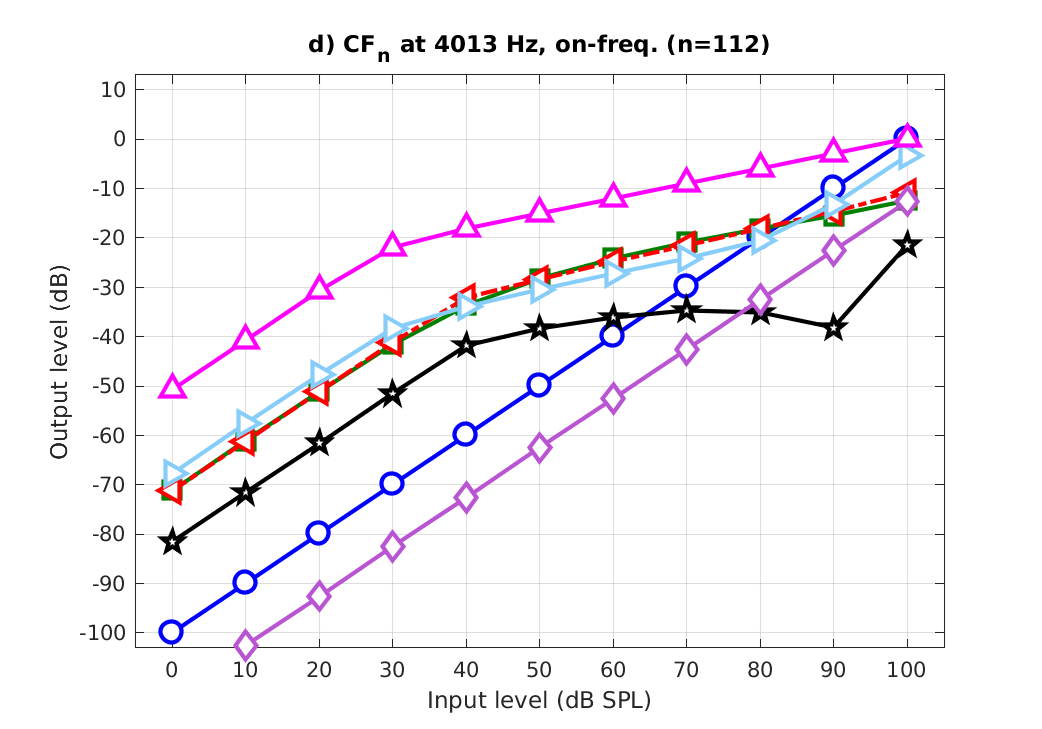
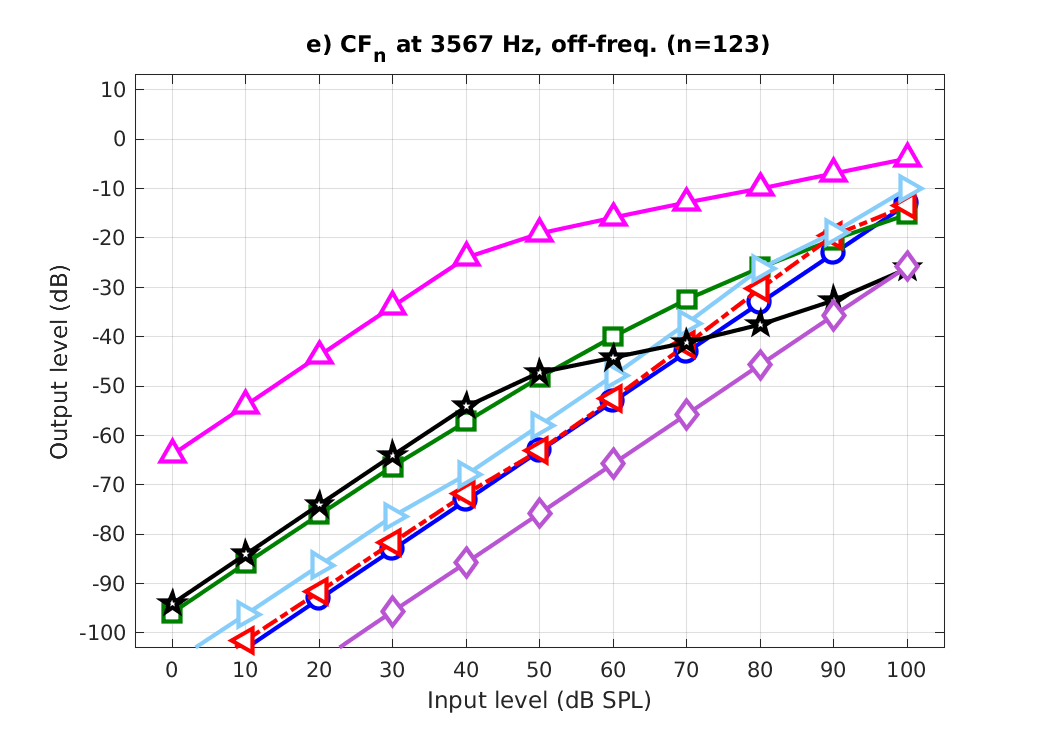
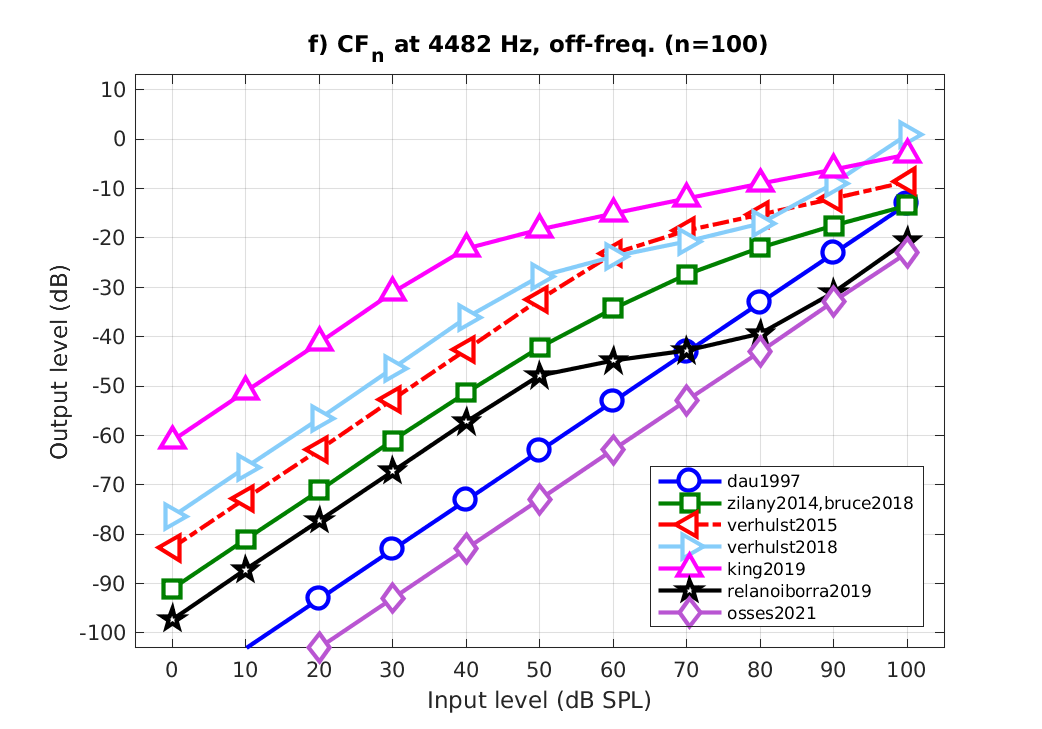
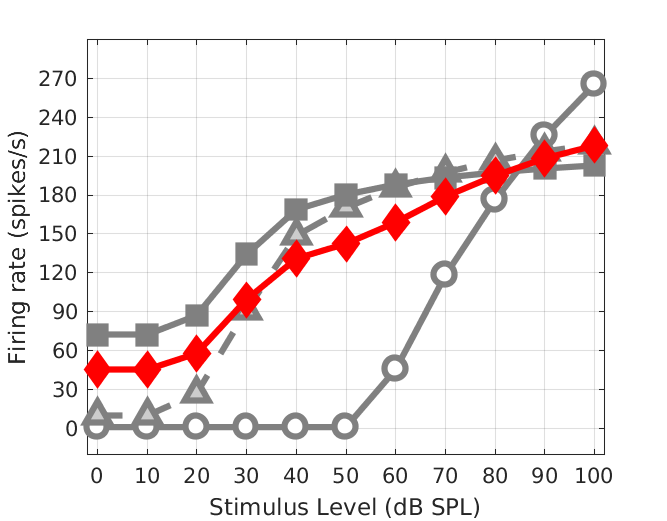
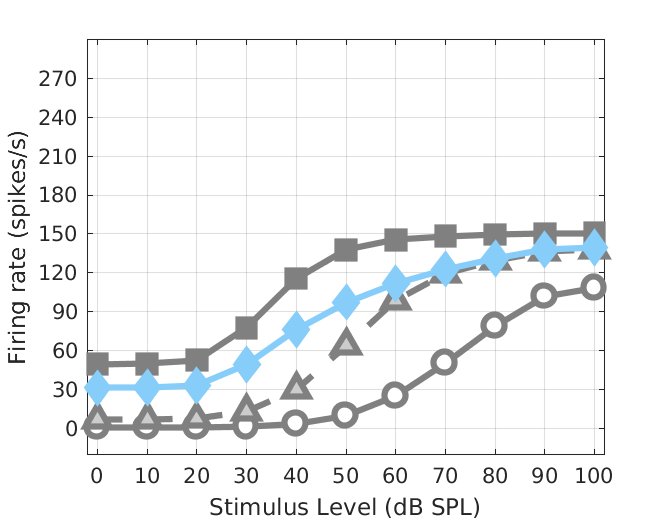
To display Figs. 7 of Osses et al., (2022) use
out = exp_osses2022('fig7'); % this flag will obtain both figures, 6 and 7

To display Figs. 8 of Osses et al., (2022) use
out = exp_osses2022('fig8'); % this flag will obtain both figures, 6 and 7

To display Fig. 9 of Osses et al., (2022) use
out = exp_osses2022('fig9');
To display Fig. 10 of Osses et al., (2022) use
out = exp_osses2022('fig10');

To display Fig. 11 of Osses et al., (2022) use
out = exp_osses2022('fig11');
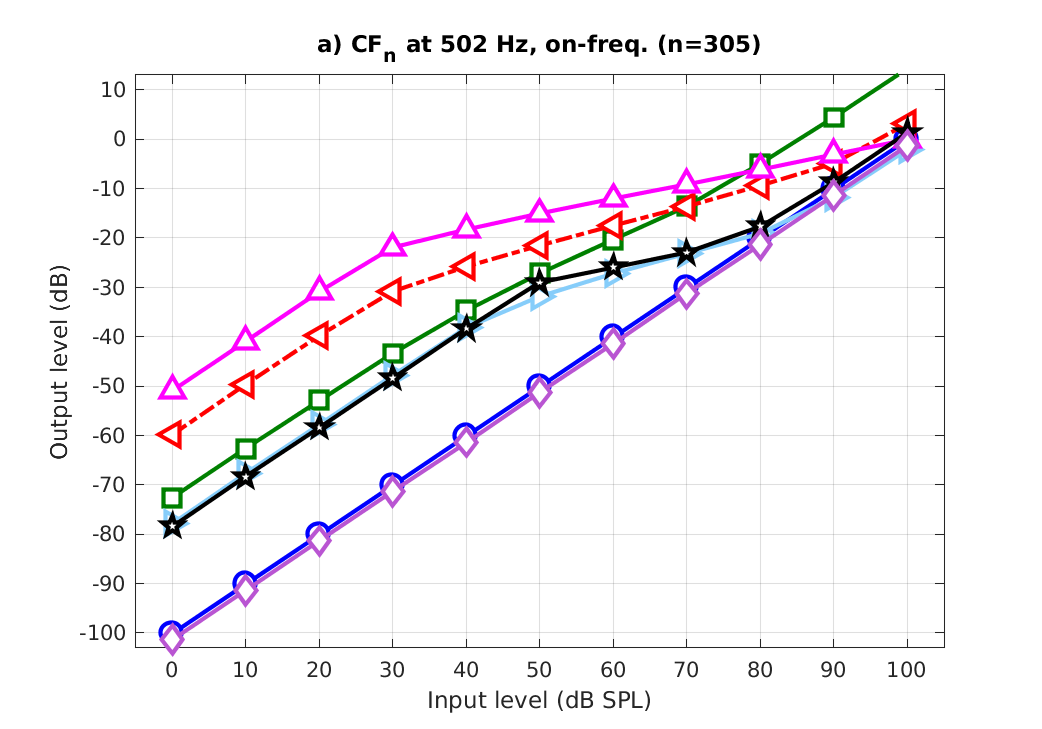
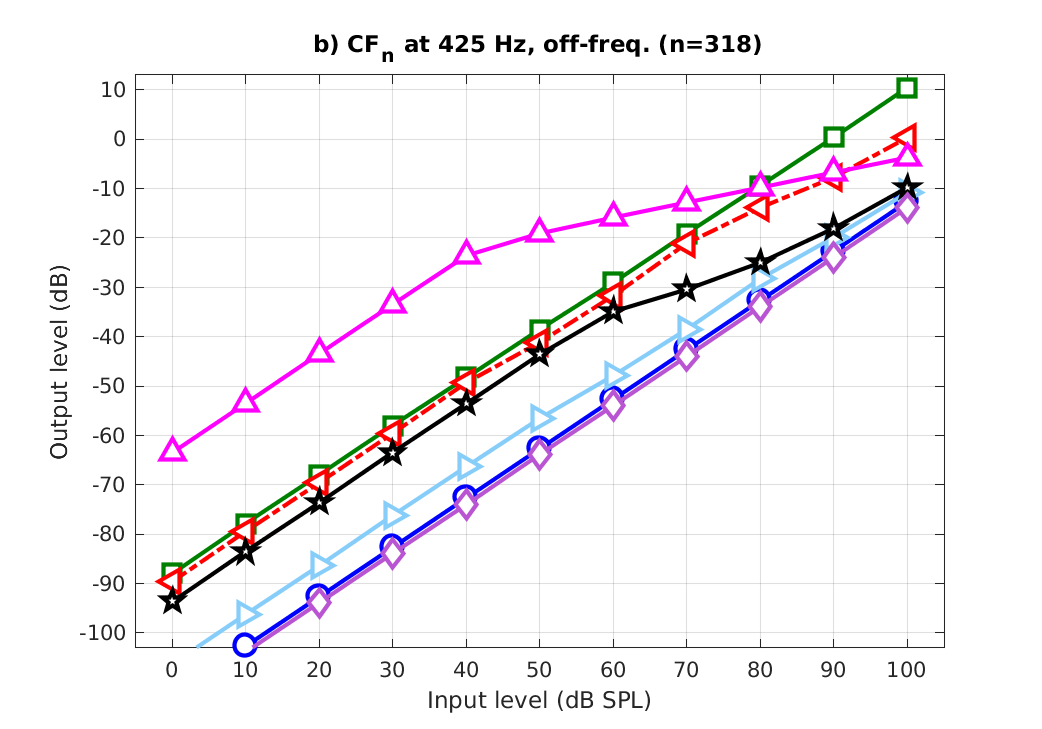
To display Fig. 12a or 12b of Osses et al., (2022) use
out = exp_osses2022('fig12a');
out = exp_osses2022('fig12b');
To display Fig. 13 of Osses et al., (2022) use
out = exp_osses2022('fig13');
To display Fig. 14a or 14b of Osses et al., (2022) use
out = exp_osses2022('fig14a');
out = exp_osses2022('fig14b');
To display Fig. 15 of Osses et al., (2022) use
out = exp_osses2022('fig15');
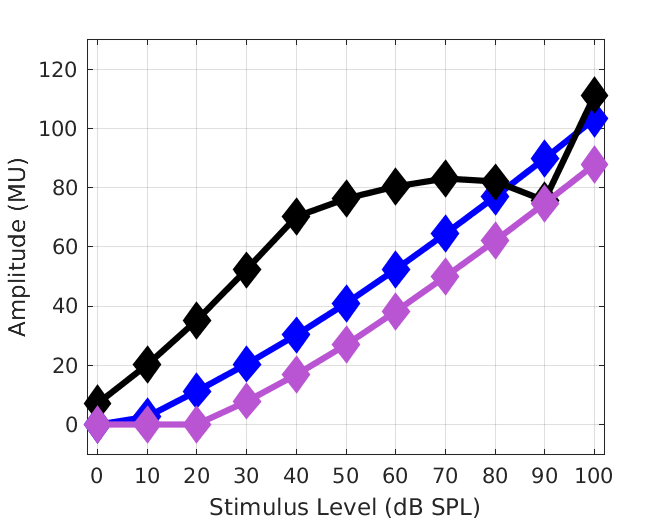
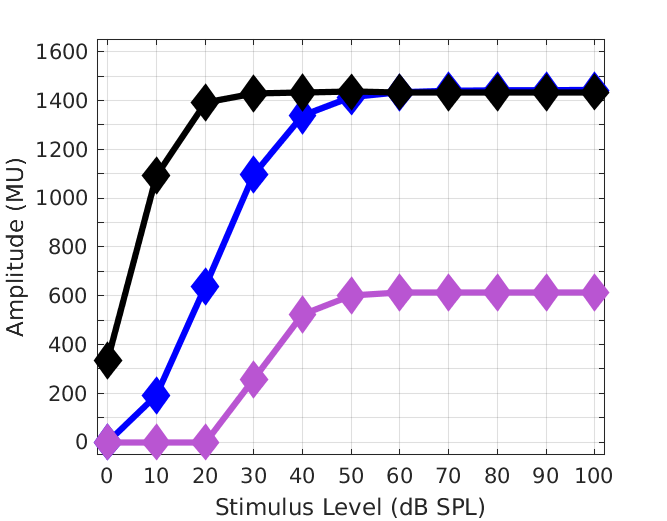
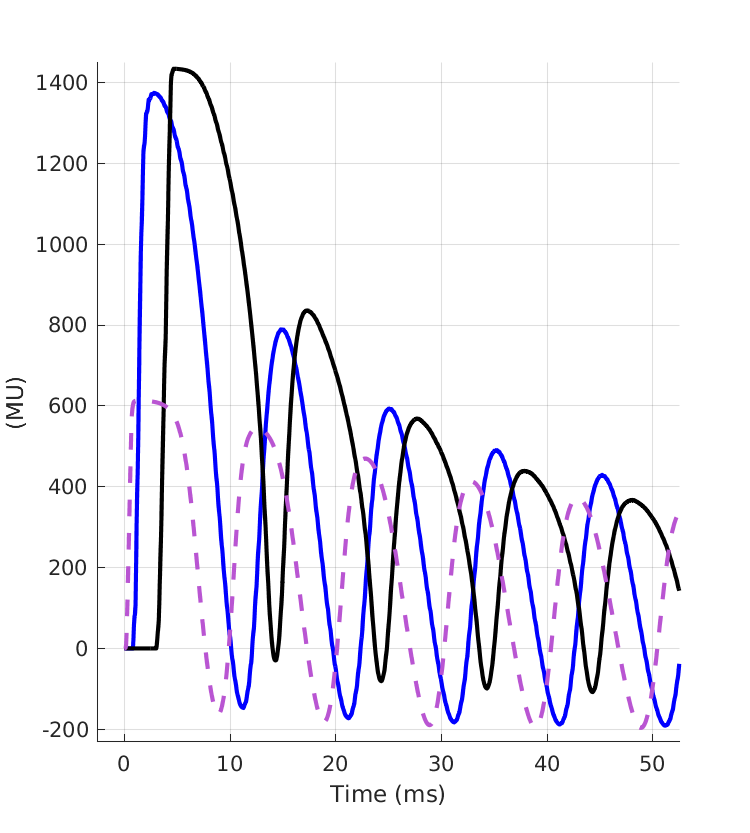
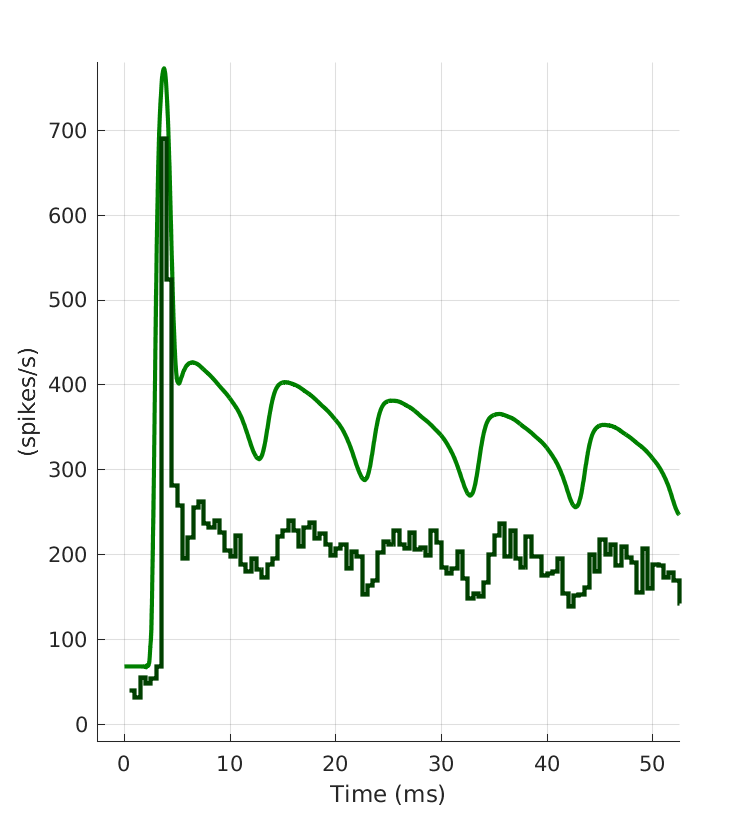
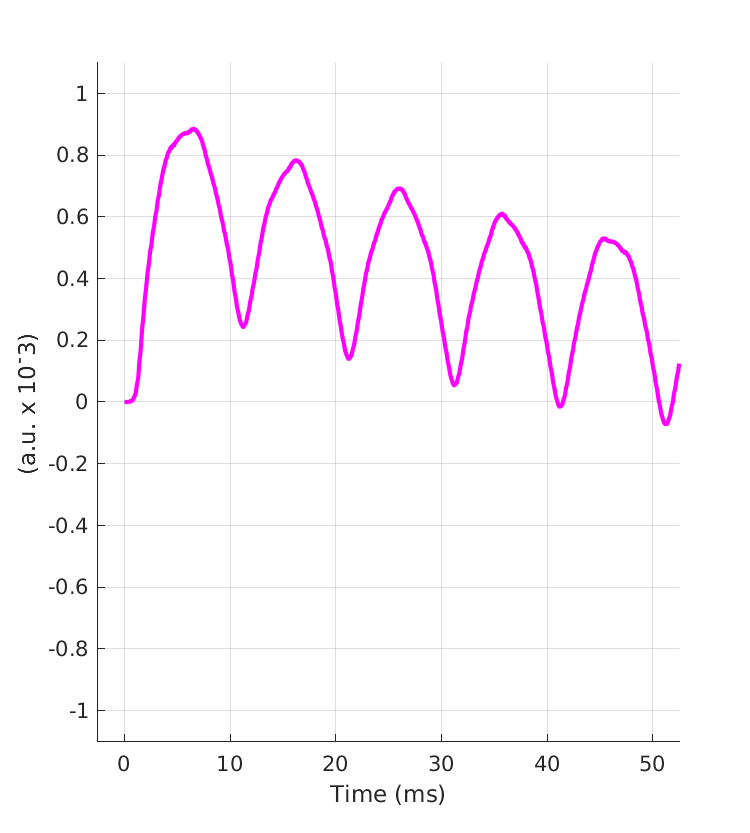
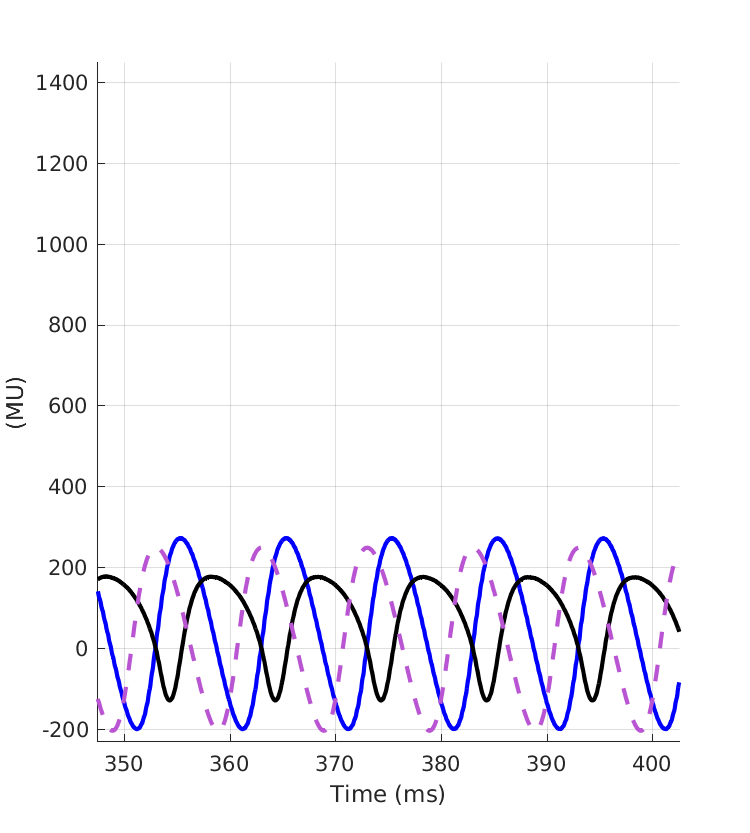
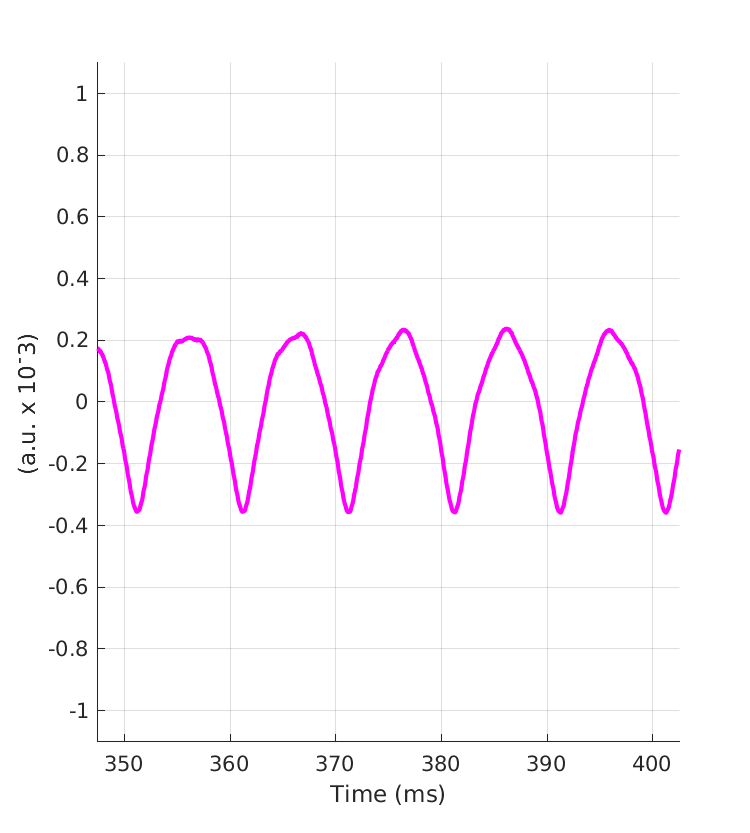
This code produces the following output:
Using Wave-V estimate only...
Using Wave-V estimate only...
Using Wave-V estimate only...
Using Wave-V estimate only...
Using Wave-V estimate only...
Using Wave-V estimate only...
Using Wave-V estimate only...
Using Wave-V estimate only...
References:
H. Relaño-Iborra, J. Zaar, and T. Dau. A speech-based computational auditory signal processing and perception model. J. Acoust. Soc. Am., 146(5), 2019.
A. Osses Vecchi and A. Kohlrausch. Perceptual similarity between piano notes: Simulations with a template-based perception model. J. Acoust. Soc. Am., 141(4), 2020.
A. King, L. Varnet, and C. Lorenzi. Accounting for masking of frequency modulation by amplitude modulation with the modulation filter-bank concept. J. Acoust. Soc. Am., 145(2277), 2019.
I. C. Bruce, Y. Erfani, and M. S. R. Zilany. A phenomenological model of the synapse between the inner hair cell and auditory nerve: Implications of limited neurotransmitter release sites. Hearing Research, 360:40--54, 2018. [ http ]
T. Dau, B. Kollmeier, and A. Kohlrausch. Modeling auditory processing of amplitude modulation. I. Detection and masking with narrow-band carriers. J. Acoust. Soc. Am., 102:2892--2905, 1997a.
M. S. A. Zilany, I. C. Bruce, and L. H. Carney. Updated parameters and expanded simulation options for a model of the auditory periphery. The Journal of the Acoustical Society of America, 135(1):283--286, Jan. 2014. [ DOI ]
S. Verhulst, H. Bharadwaj, G. Mehraei, C. Shera, and B. Shinn-Cunningham. Functional modeling of the human auditory brainstem response to broadband stimulation. jasa, 138(3):1637--1659, 2015.
S. Verhulst, A. Altoè, and V. Vasilkov. Functional modeling of the human auditory brainstem response to broadband stimulation. hearingresearch, 360:55--75, 2018.
A. Osses, S. Verhulst, L. Varnet, T. Dau, L. H. Carney, I. C. Bruce, and P. Majdak. A comparative study of eight human auditory models including brainstem processing. Acta Acustica, 2022.


Build with Bootstrap