THE AUDITORY MODELING TOOLBOX
exp_osses2022
Comparison of eight monaural models
Usage:
data = exp_osses2022(flags)
data = exp_osses2022(..., 'models', models)
Description:
The following flags can be specified:
| 'fig3' | Reproduce Fig. 3. |
| 'fig4' | Reproduce Fig. 4. |
| 'fig5' | Reproduce Fig. 5. |
| 'fig6' | Reproduce Fig. 6. |
| 'fig7' | Reproduce Fig. 7. |
| 'fig8' | Reproduce Fig. 8. |
| 'fig9' | Reproduce Fig. 9. |
| 'fig10' | Reproduce Fig. 10. |
| 'fig11' | Reproduce Fig. 11. |
| 'fig12a' | Reproduce Fig. 12a. |
| 'fig12b' | Reproduce Fig. 12b. |
| 'fig13' | Reproduce Fig. 13. |
| 'fig14a' | Reproduce Fig. 14a. |
| 'fig14b' | Reproduce Fig. 14b. |
| 'fig15' | Reproduce Fig. 15. |
exp_osses2022(flags) reproduces the figures from Osses et al. (2022), where the following models are compared:
- #1: dau1997, model from Dau et al., (1997).
- #2: zilany2014, model from Zilany et al., (2014).
- #3: verhulst2015, model from Verhulst et al., (2015).
- #4: verhulst2018, model from Verhulst et al., (2018).
- #5: bruce2018, model from Bruce et al., (2018).
- #6: king2019, model from King et al., (2019).
- #7: relanoiborra2019, model from Relano-Iborra et al., (2019).
- #8: osses2021, model from Osses and Kohlrausch (2021).
exp_osses2022(..., 'models', models) can be used to show data for specific models only. To this end, models is a vector selecting the models by the index as show in the list above. For example if models is [1 3 6] then the data for Dau et al., (1997), Verhulst et al., (2015), and King et al., (2019) will be shown only.
Additionally, the following flags can be specified:
| 'redo' | Recomputes data for specified figure. Optional. Default: 'normal' which uses the cached data if available. |
| 'plot' | Plot the output of the experiment. This is the default. |
| 'no_plot' | Doesn't plot, only return some data (see code). |
Figures:
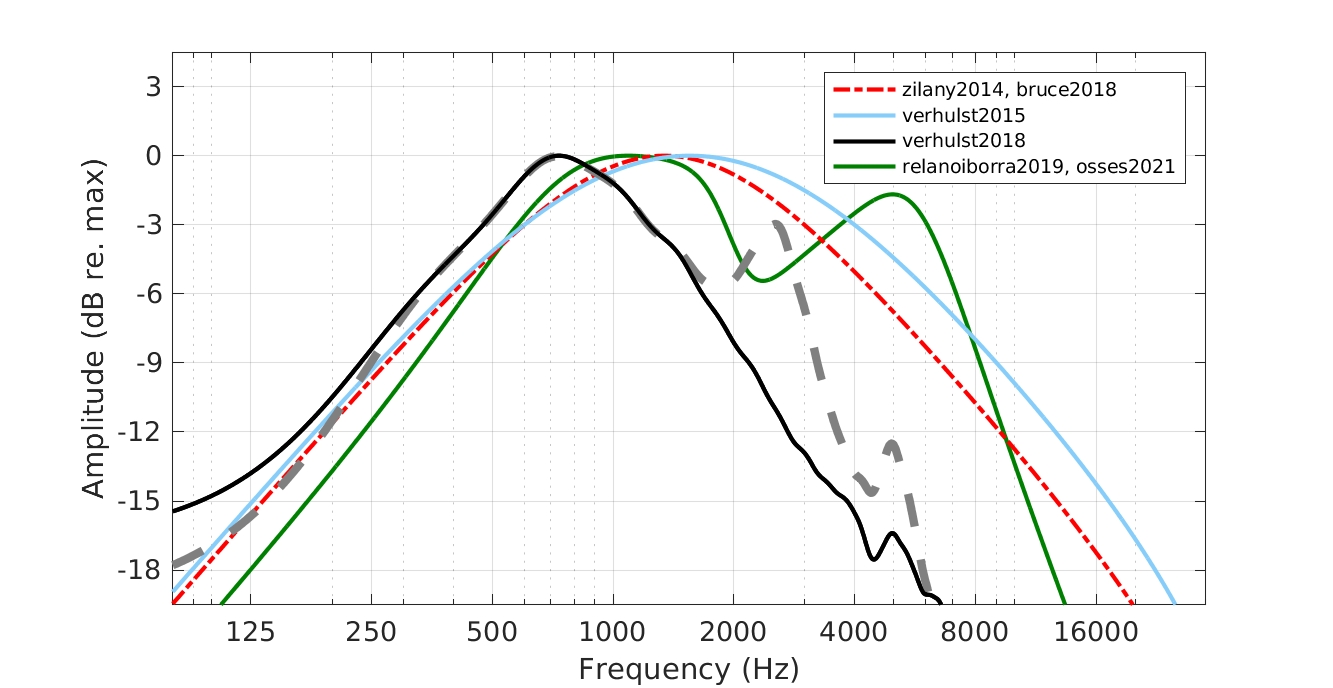
To display Fig. 3 of Osses et al., (2022) use :
out = exp_osses2022('fig3');
|
|
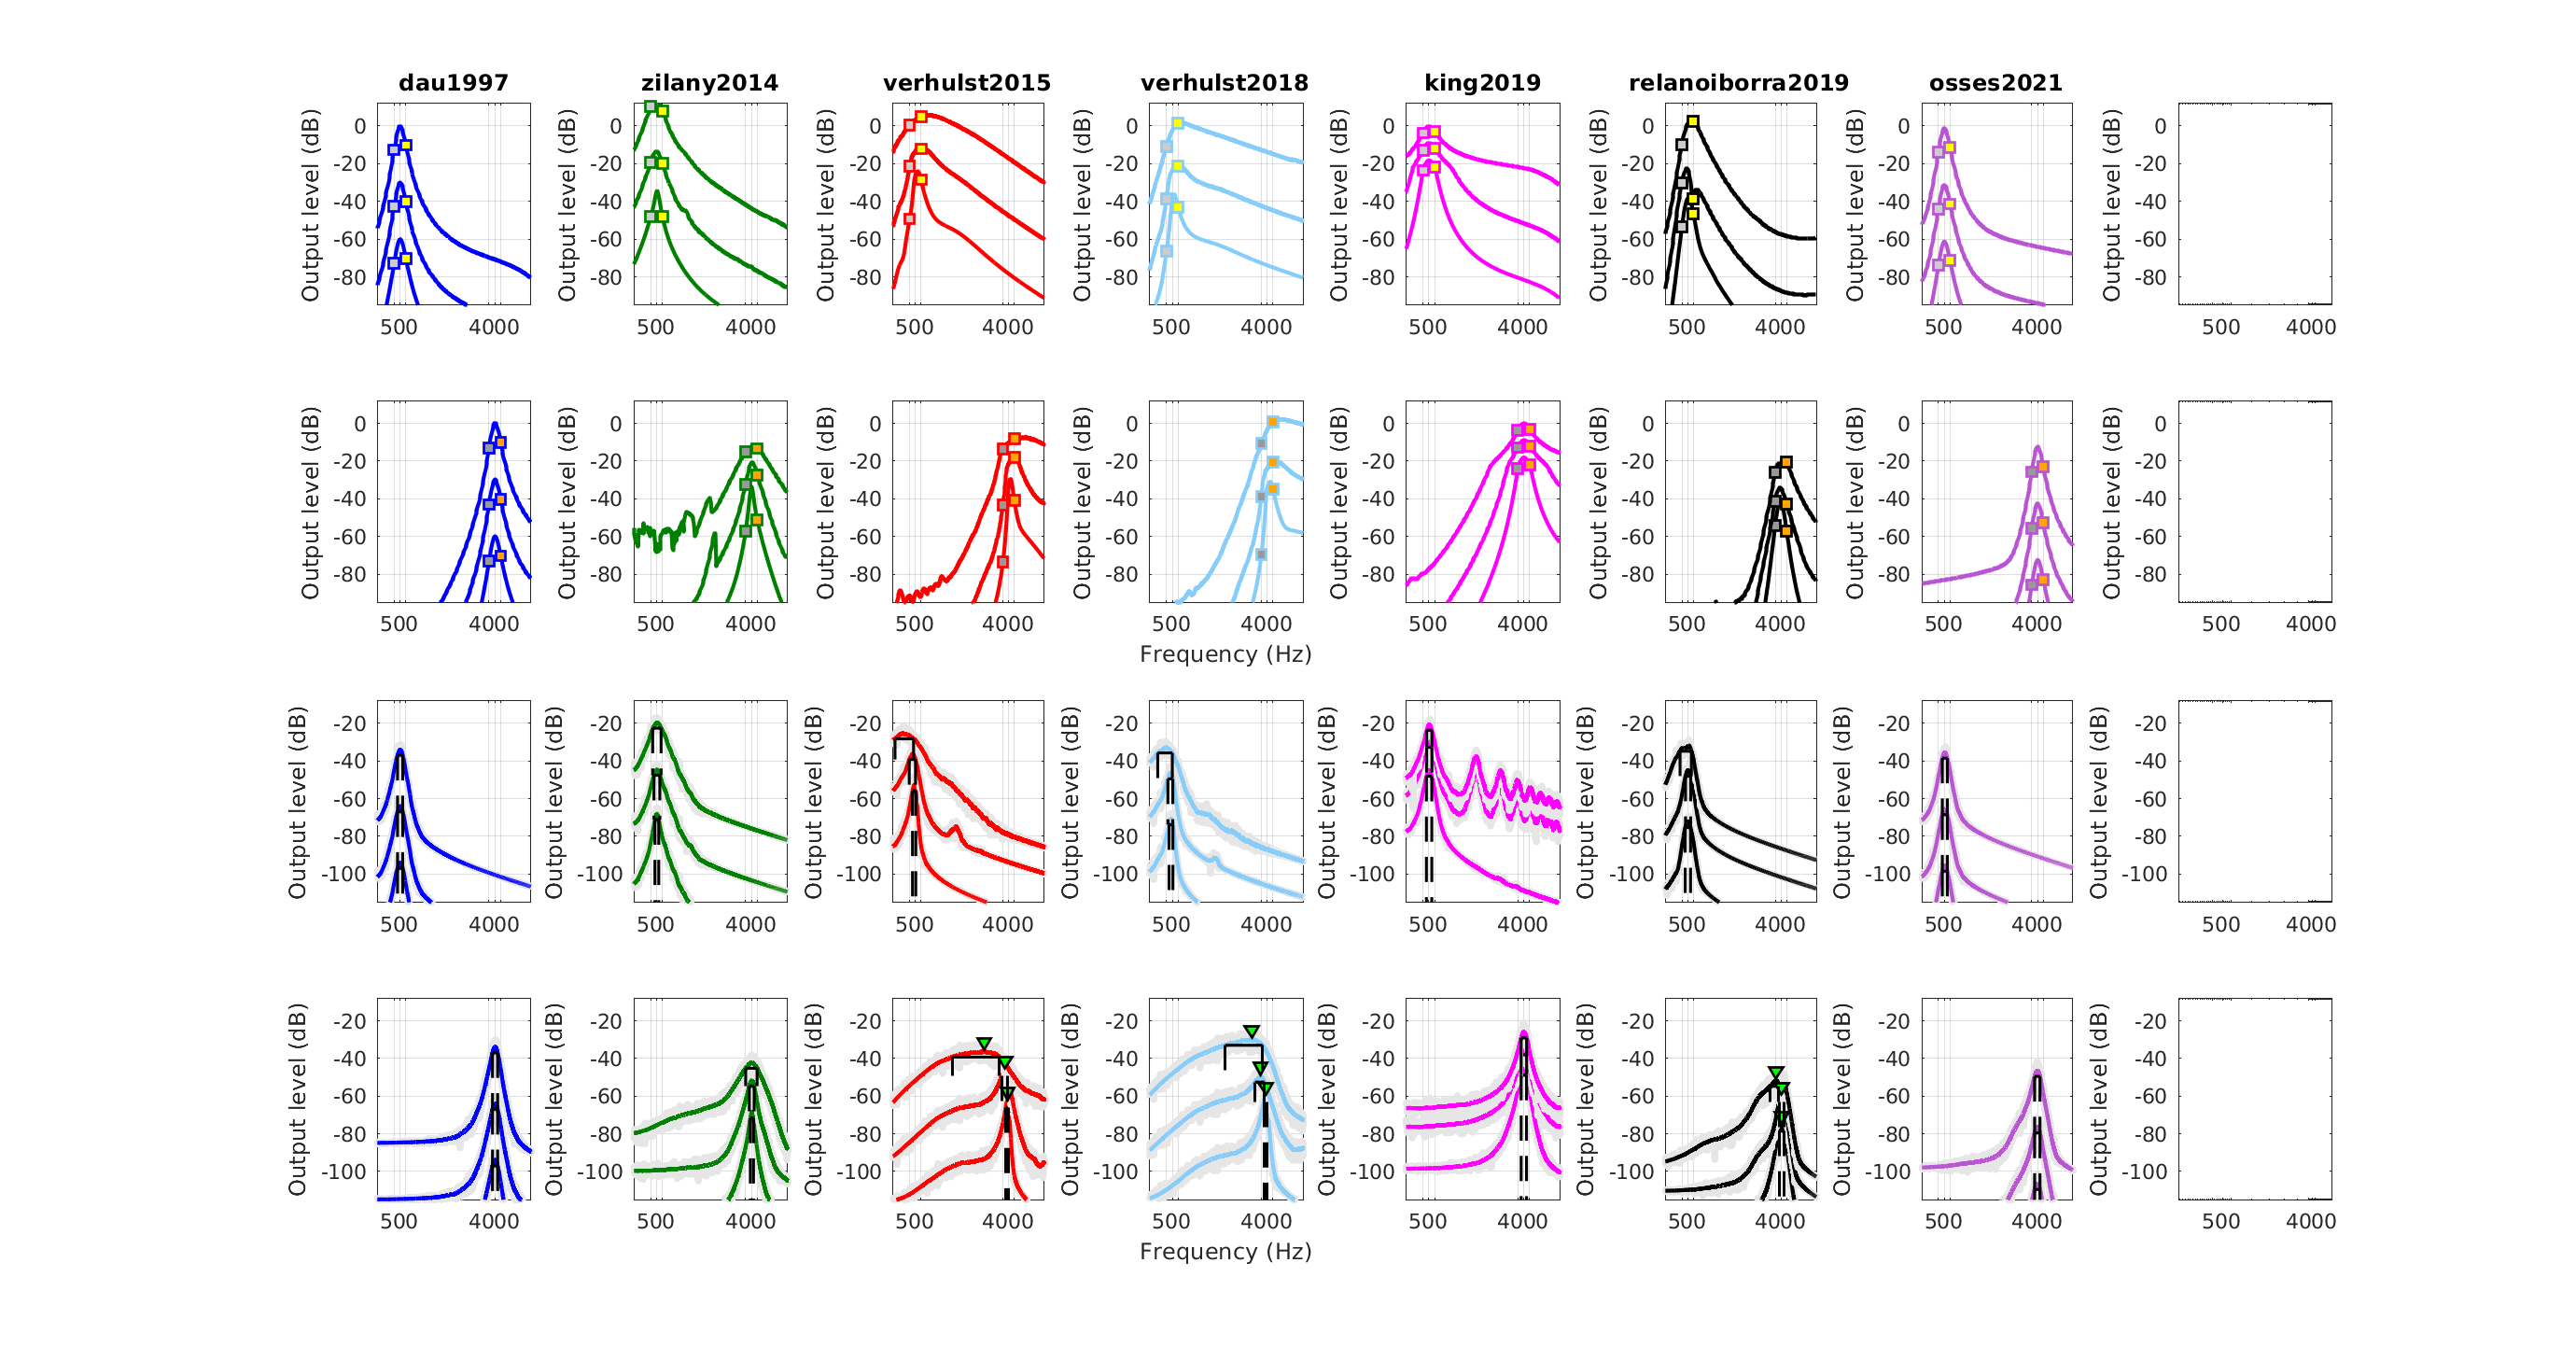
To display Fig. 4 of Osses et al., (2022) use :
out = exp_osses2022('fig4');
|
|
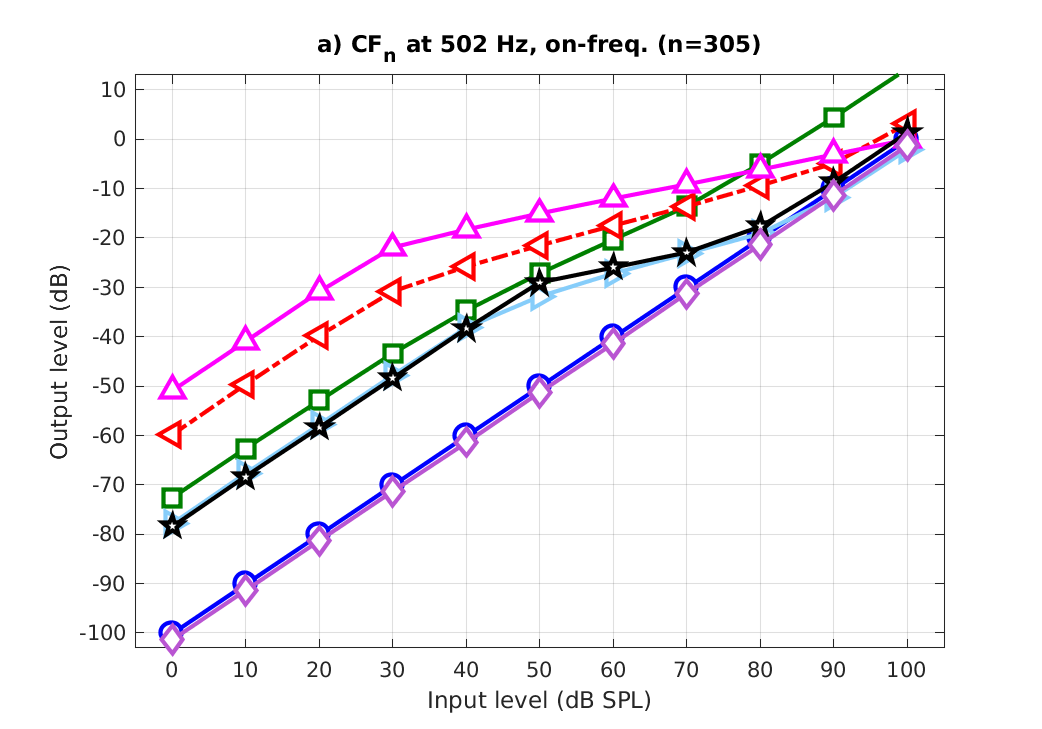
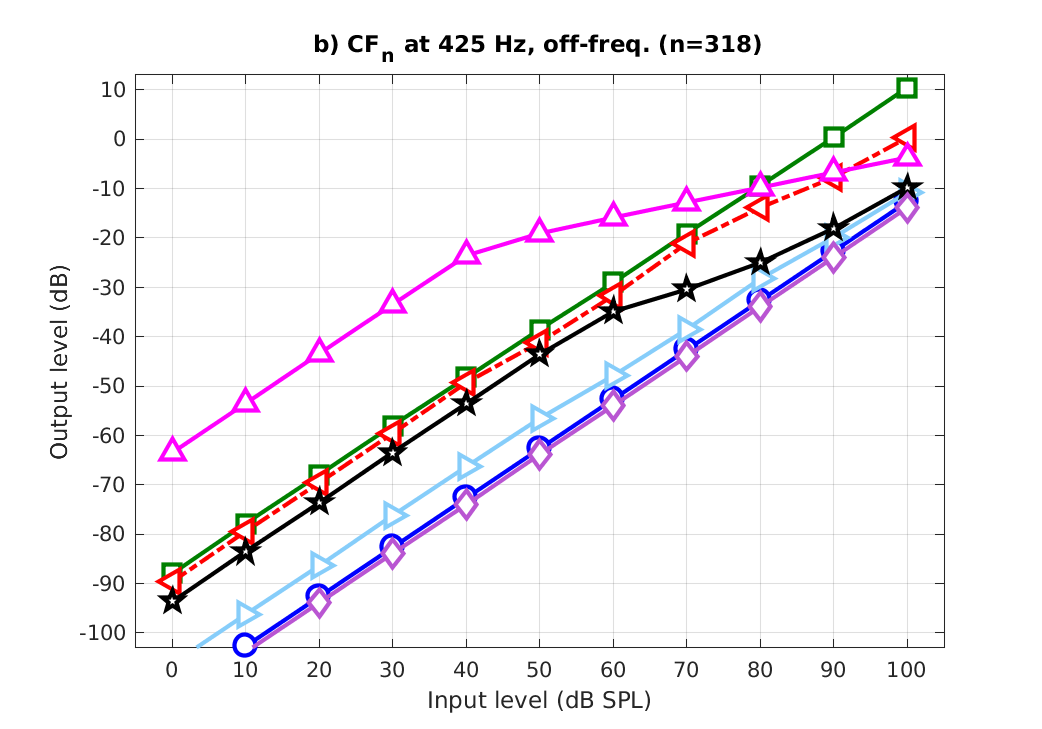
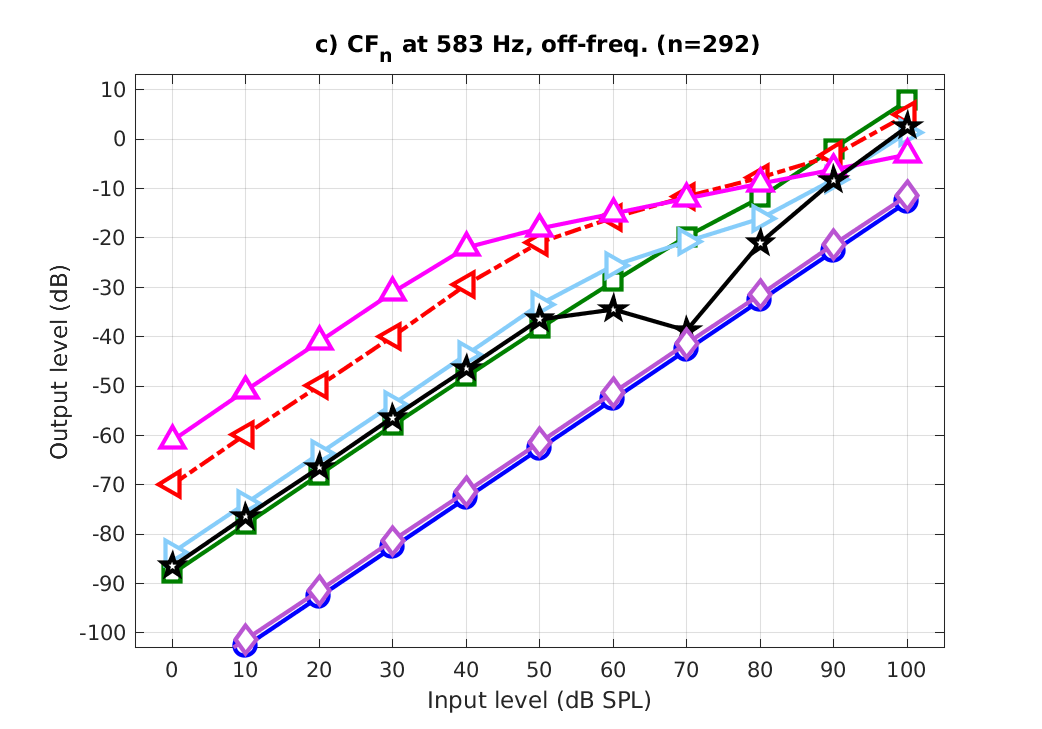
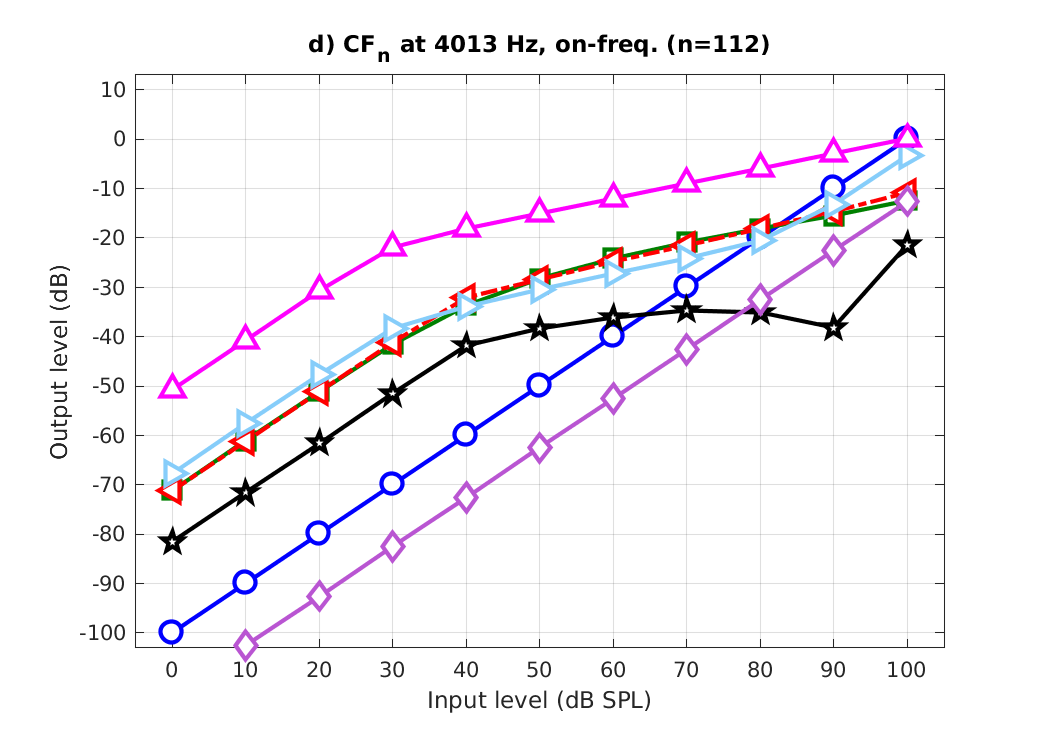
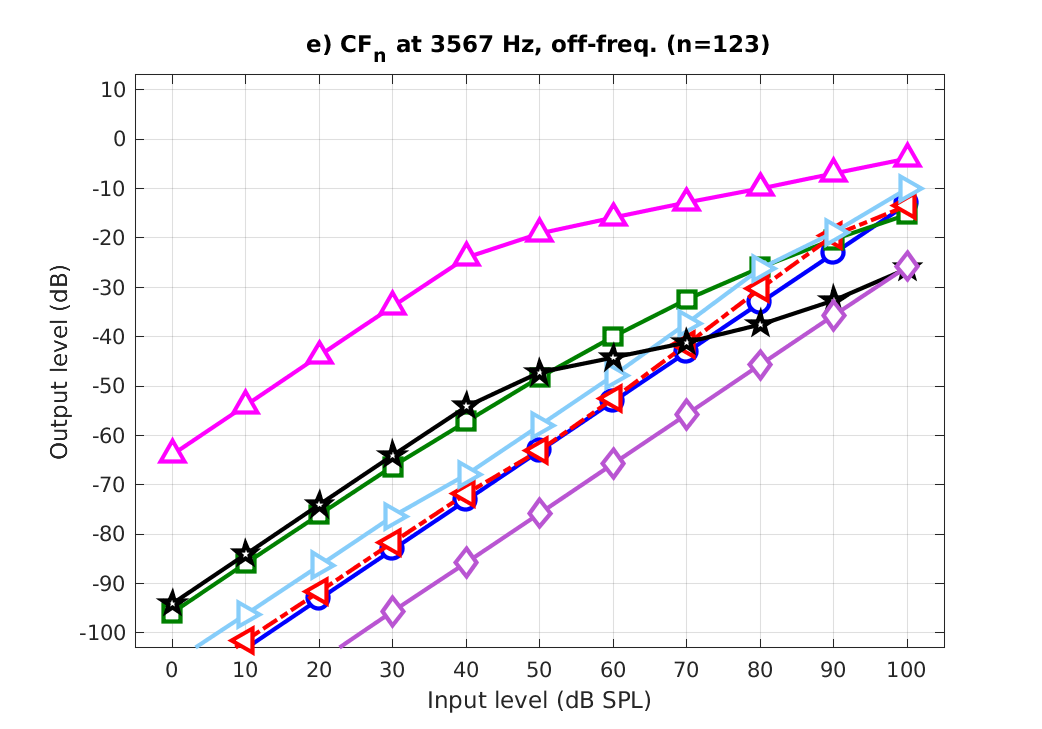
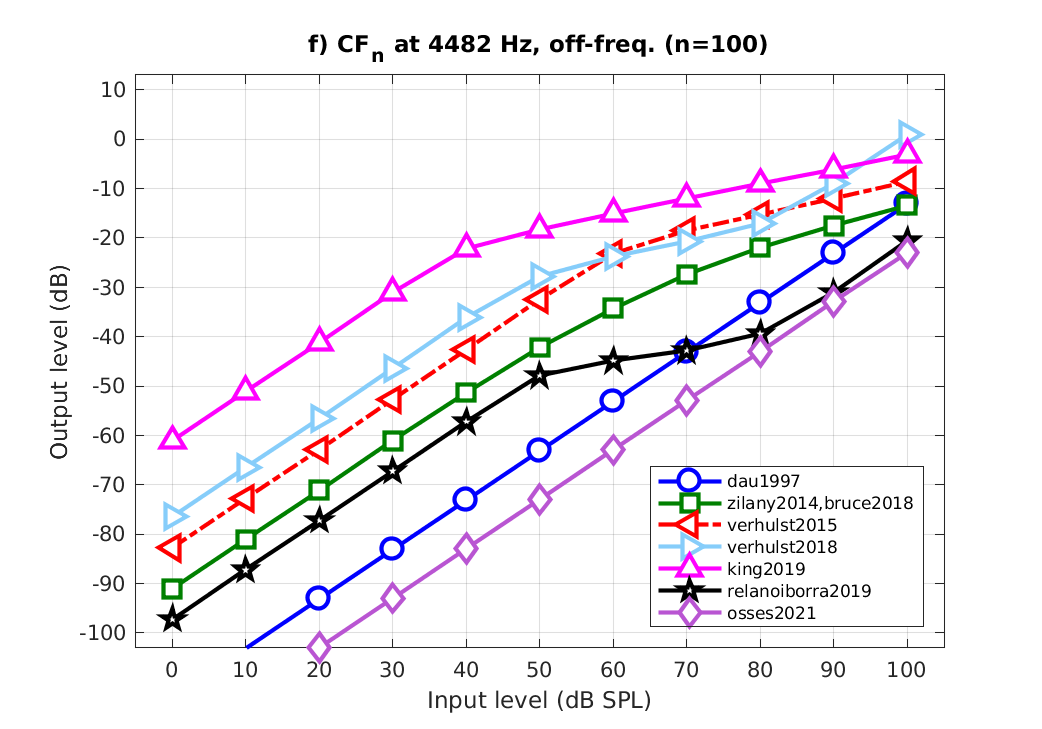
To display Fig. 5 of Osses et al., (2022) use :
out = exp_osses2022('fig5');
|
|
|
|
|
|
|
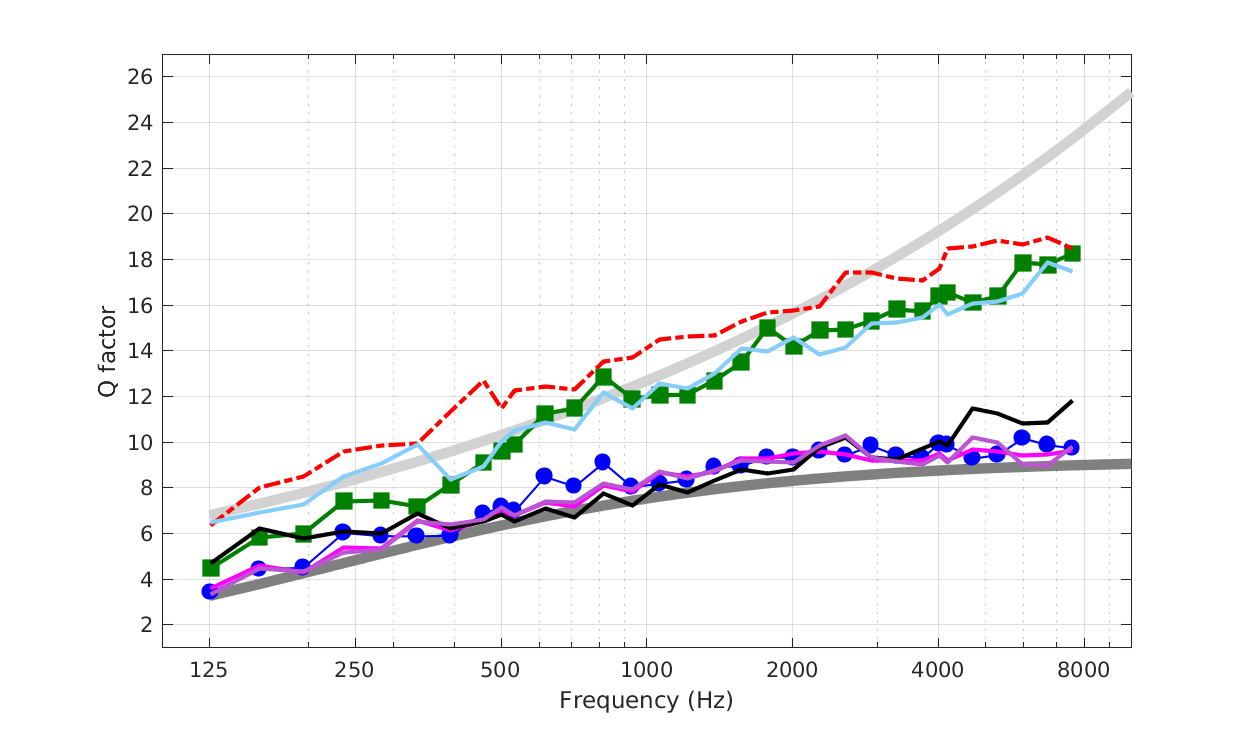
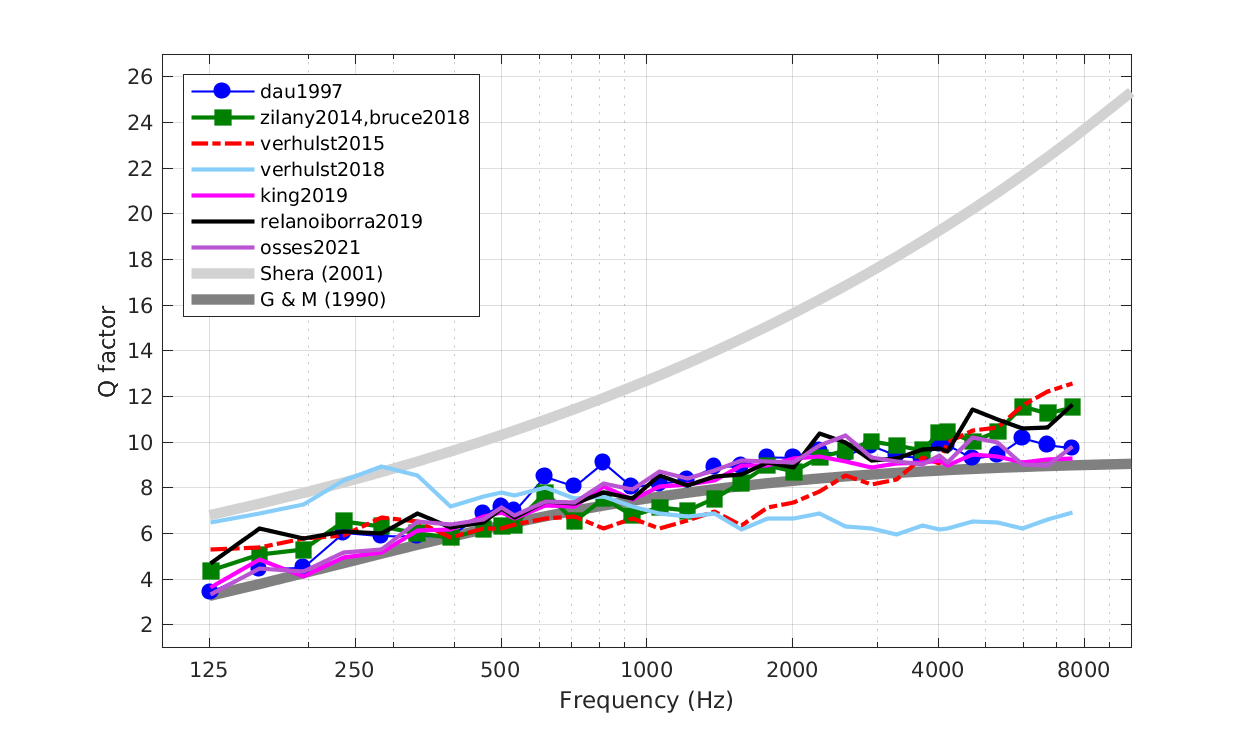
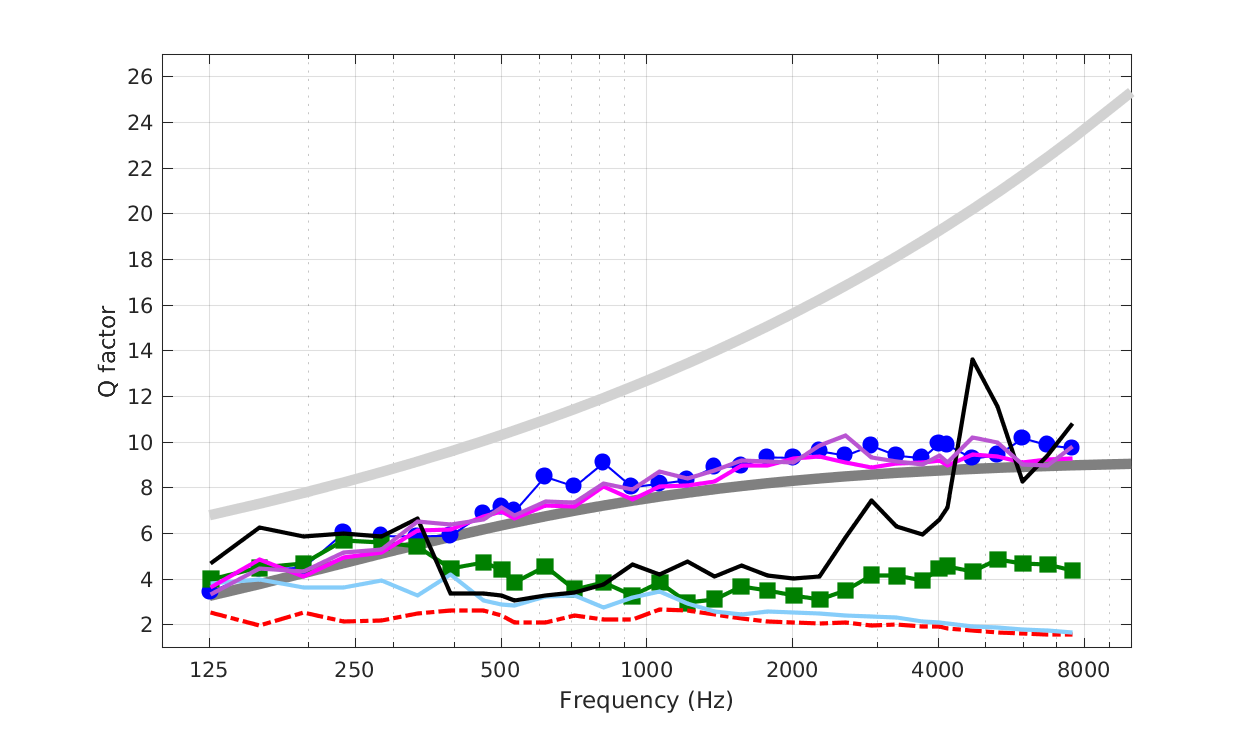
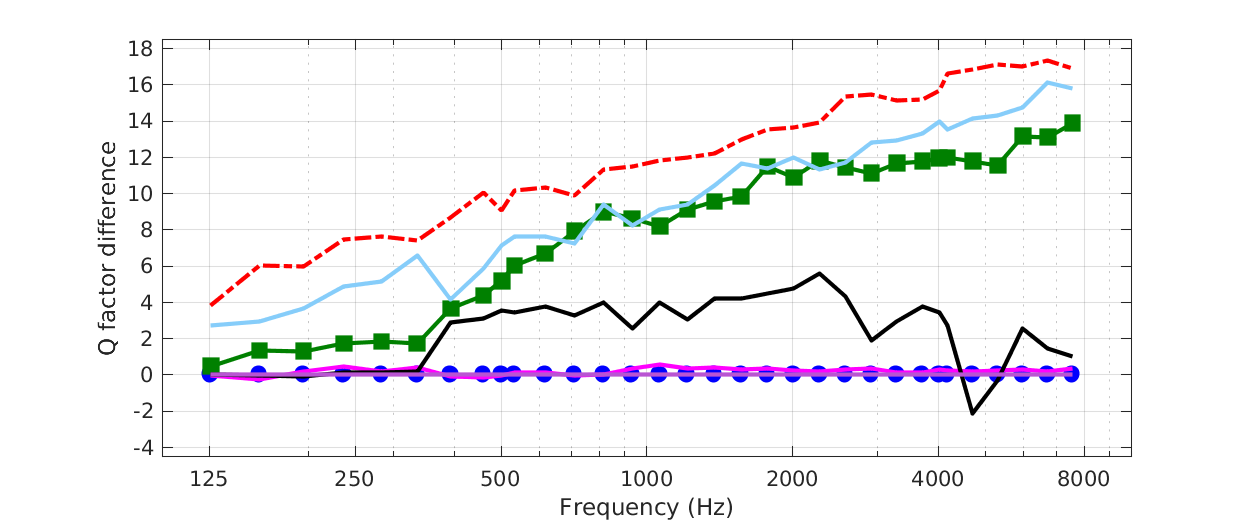
To display Fig. 6 of Osses et al., (2022) use :
out = exp_osses2022('fig6');
|
|
|
|
|
This code produces the following output:: Using Q03 Using Q03 Using Q03 |
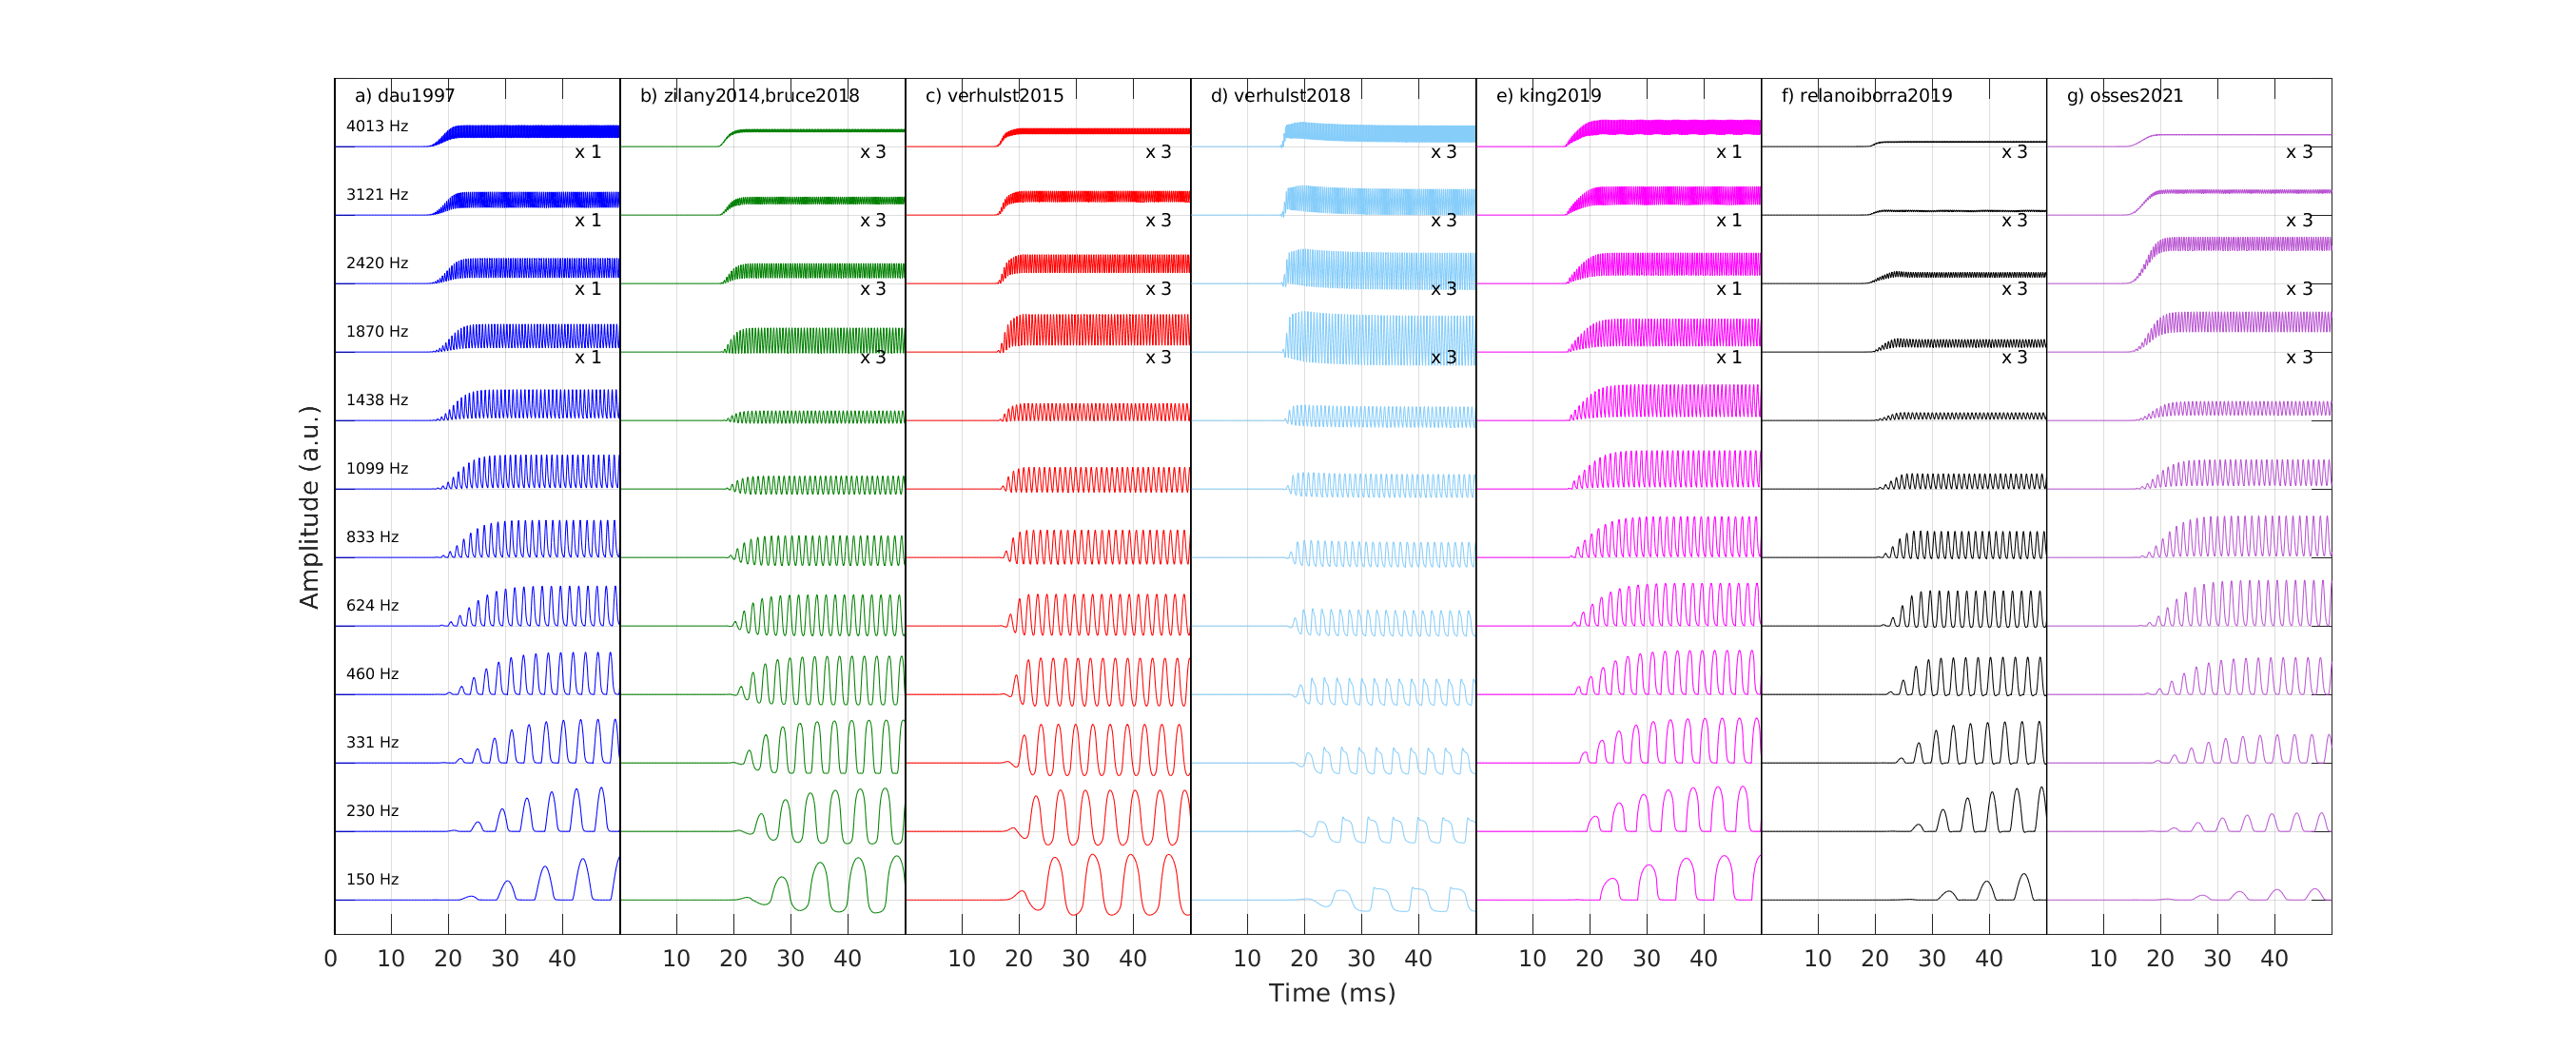
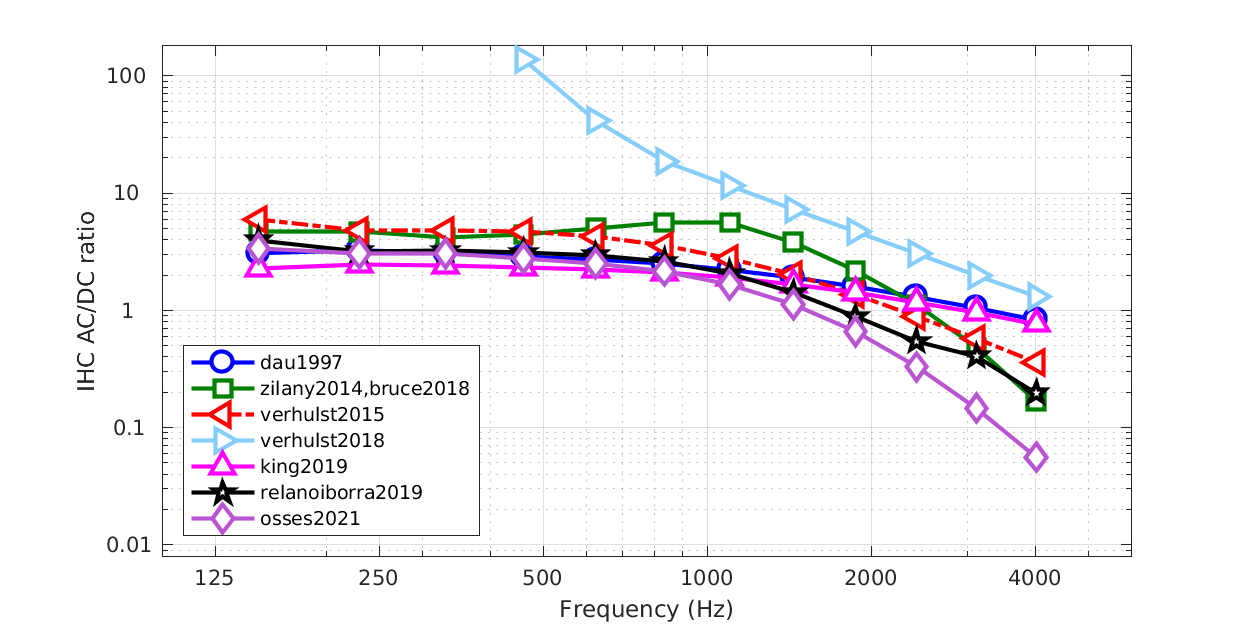
To display Figs. 7 of Osses et al., (2022) use :
out = exp_osses2022('fig7'); % this flag will obtain both figures, 6 and 7
|
|
|
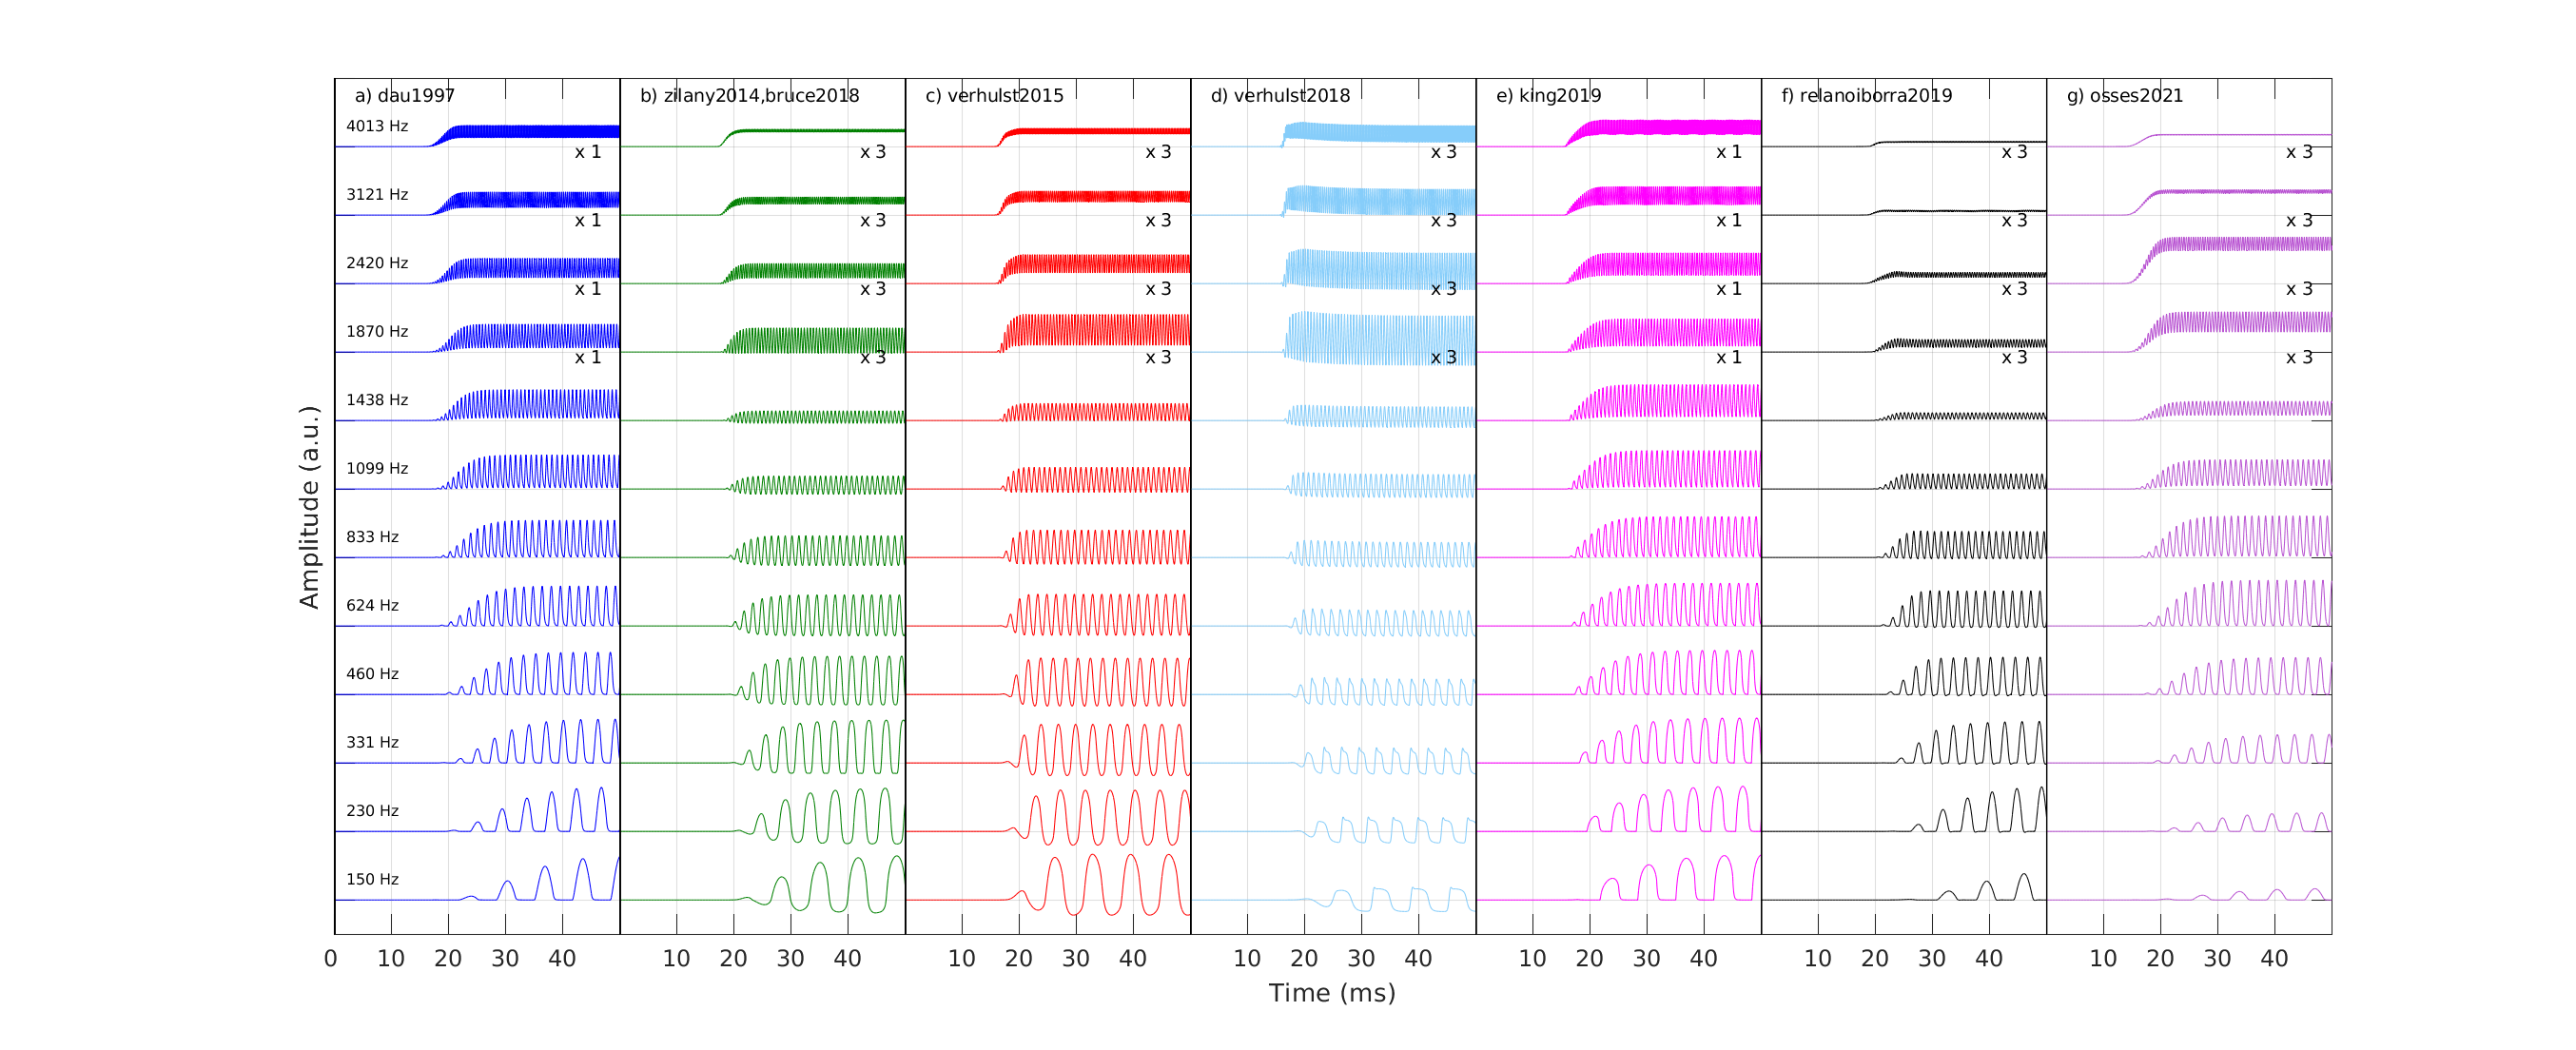
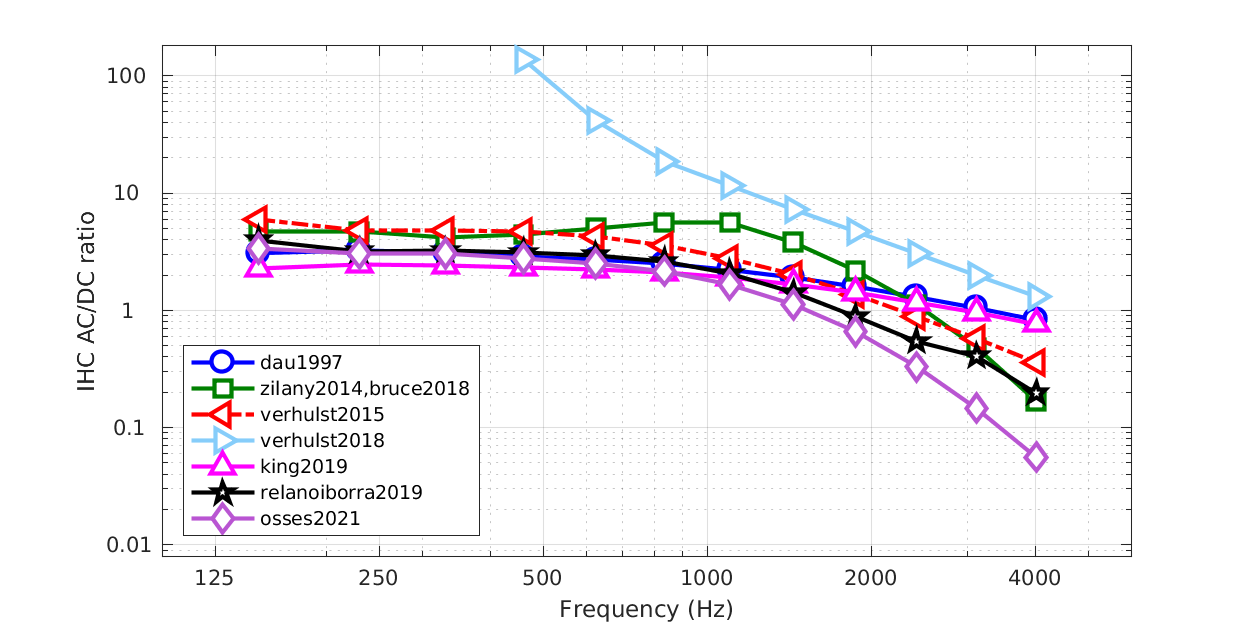
To display Figs. 8 of Osses et al., (2022) use :
out = exp_osses2022('fig8'); % this flag will obtain both figures, 6 and 7
|
|
|
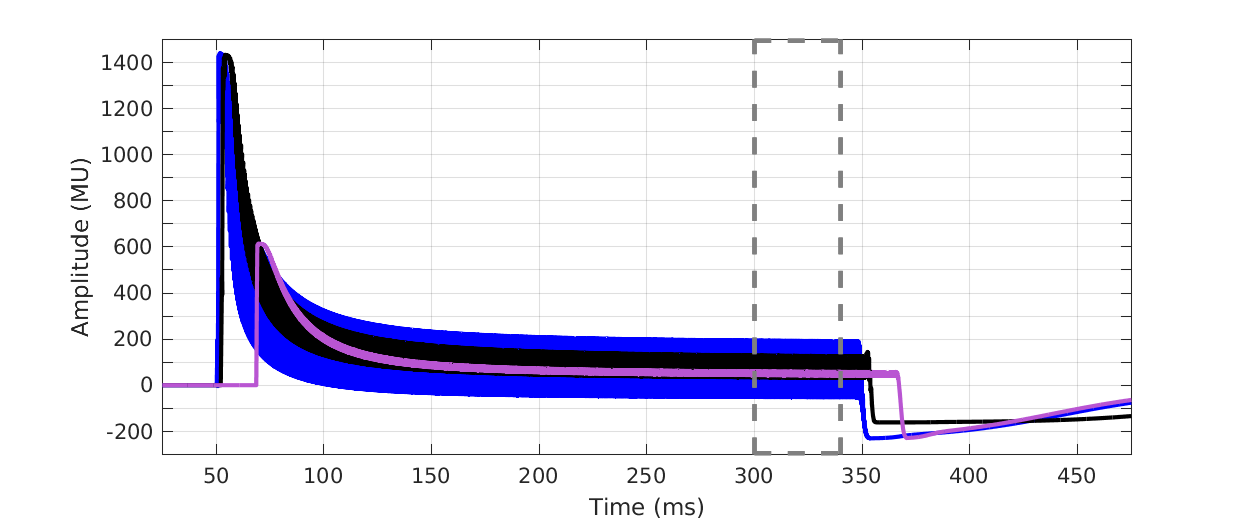
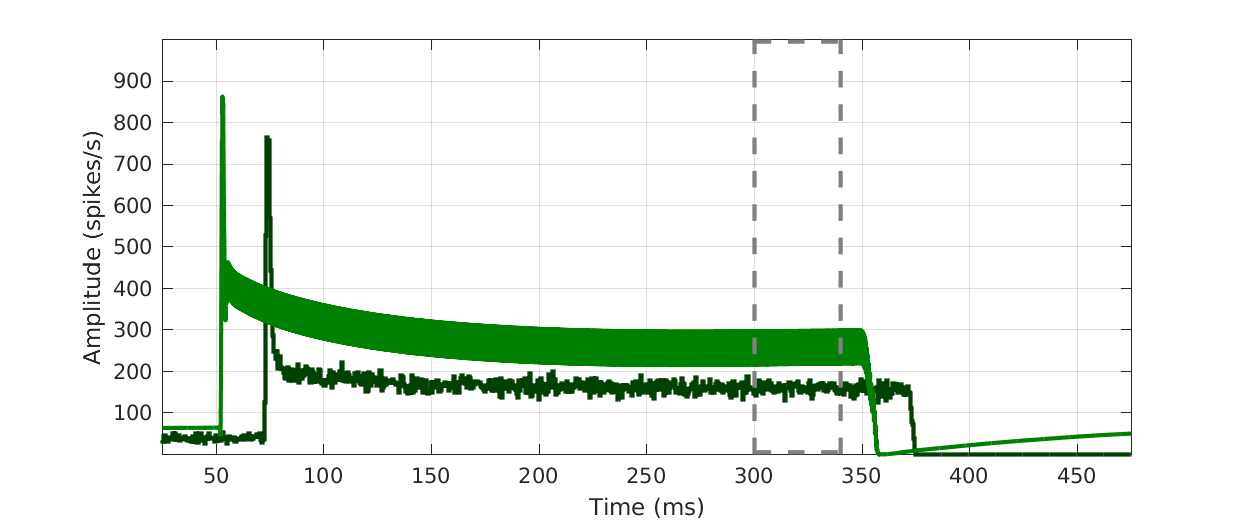
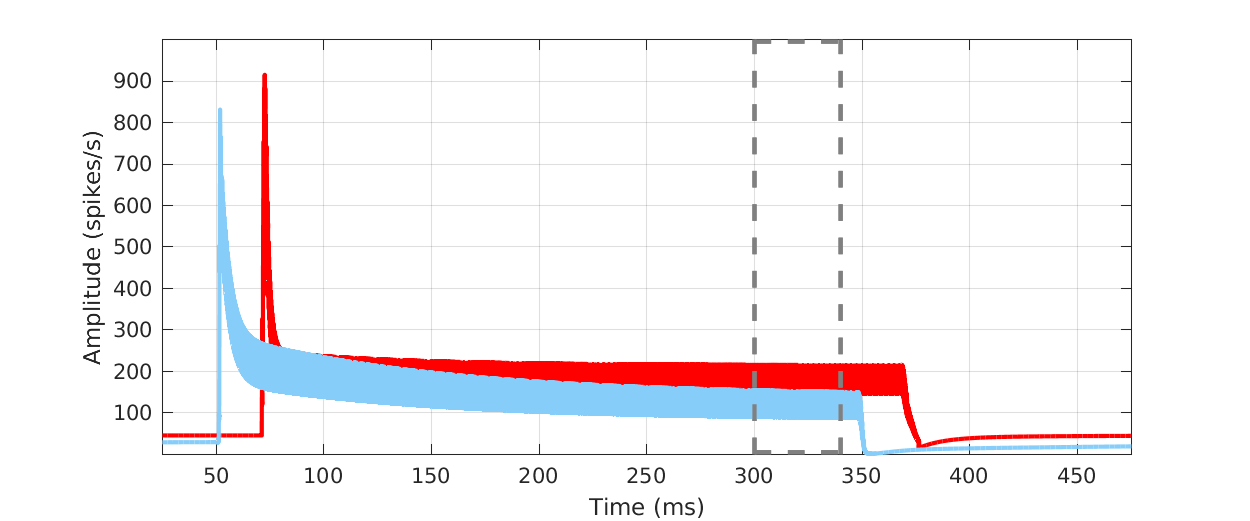
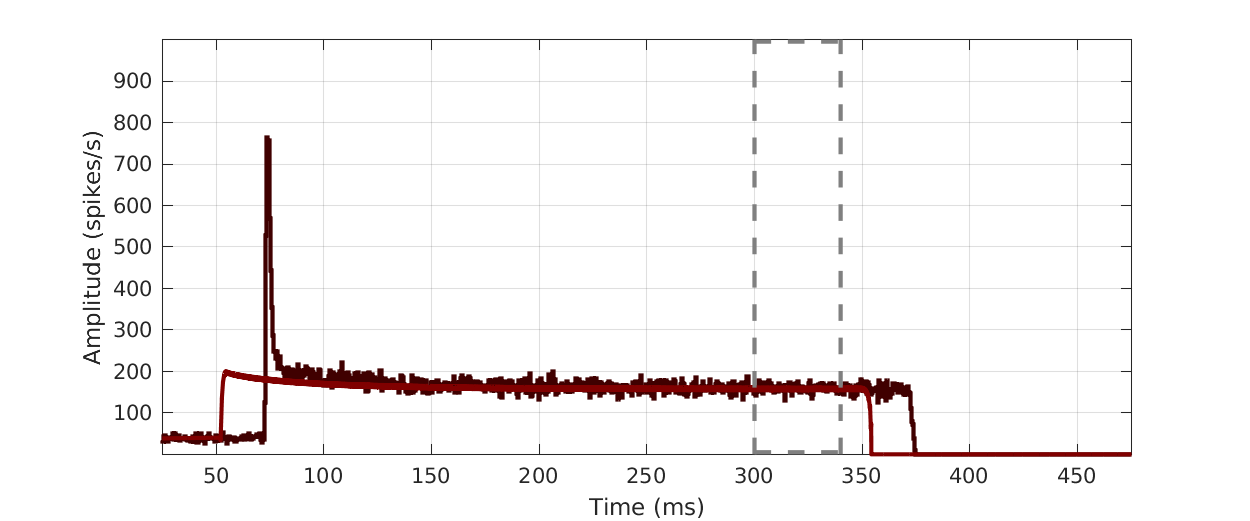
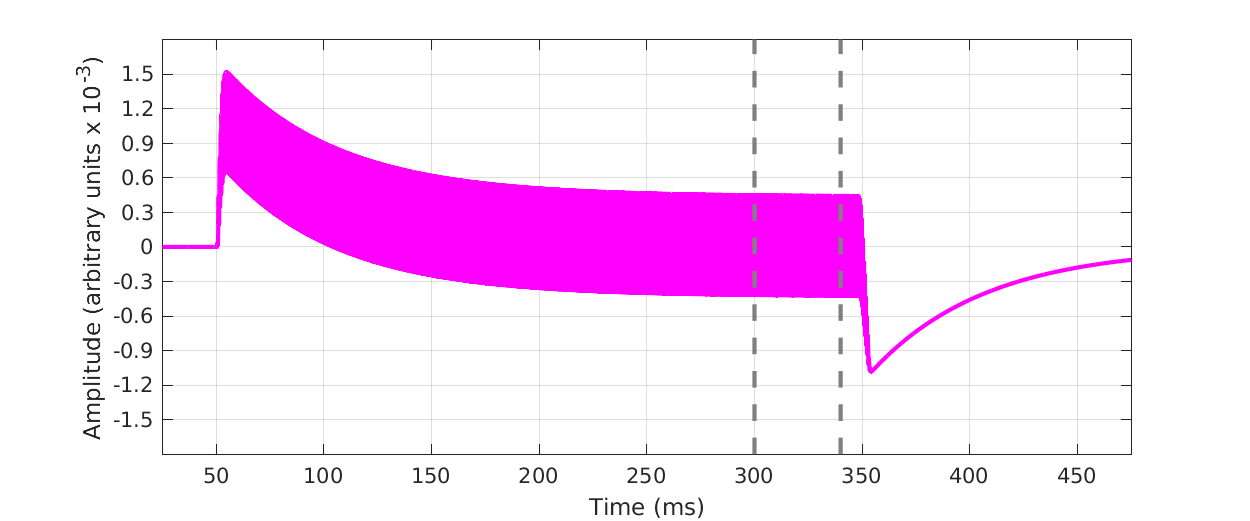
To display Fig. 9 of Osses et al., (2022) use :
out = exp_osses2022('fig9');
|
|
|
|
|
|
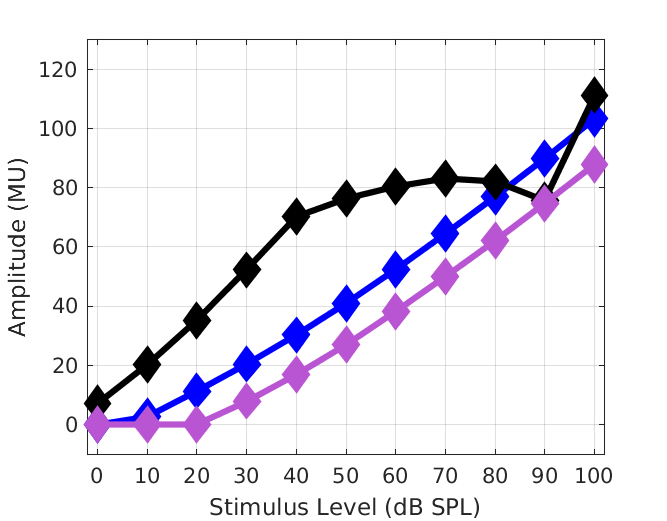
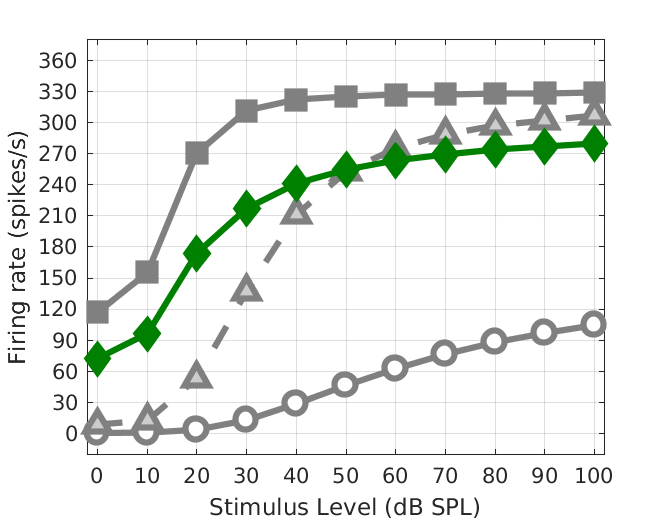
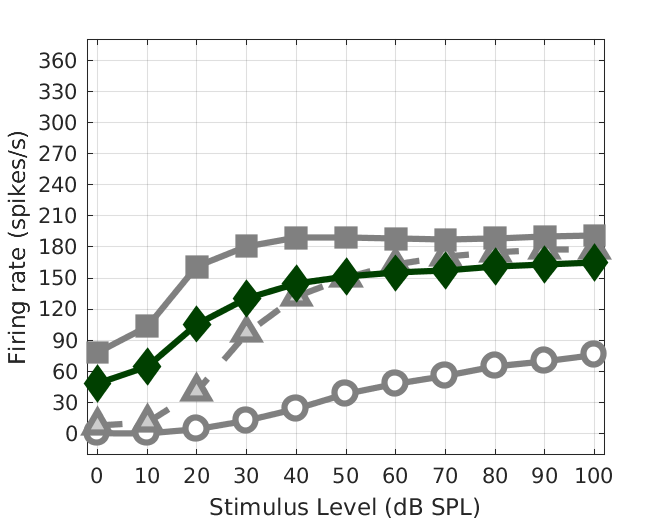
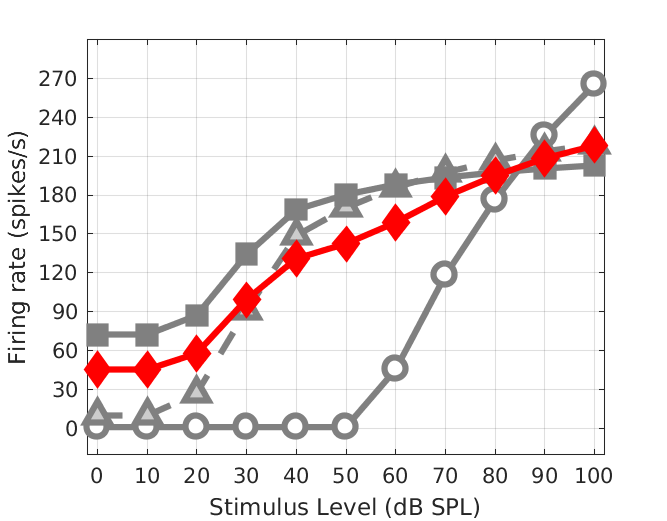
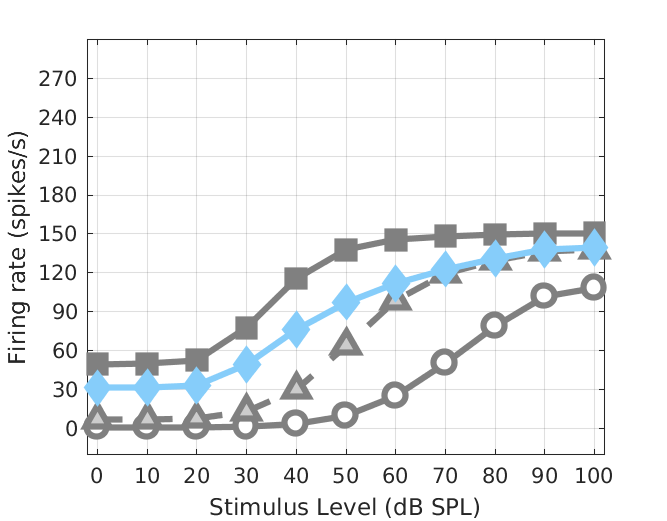
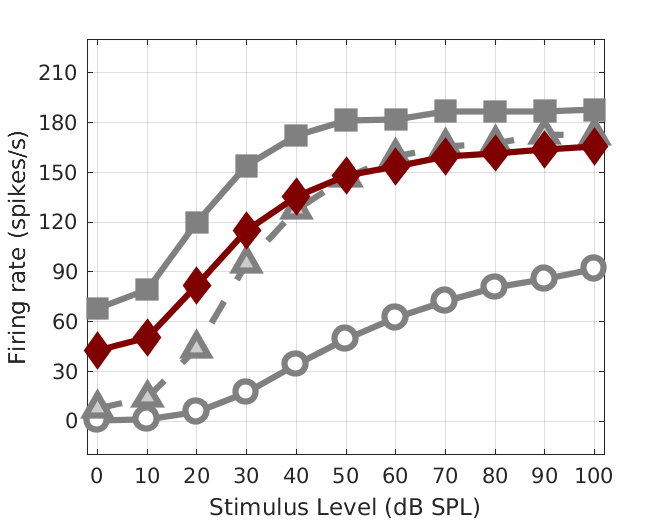
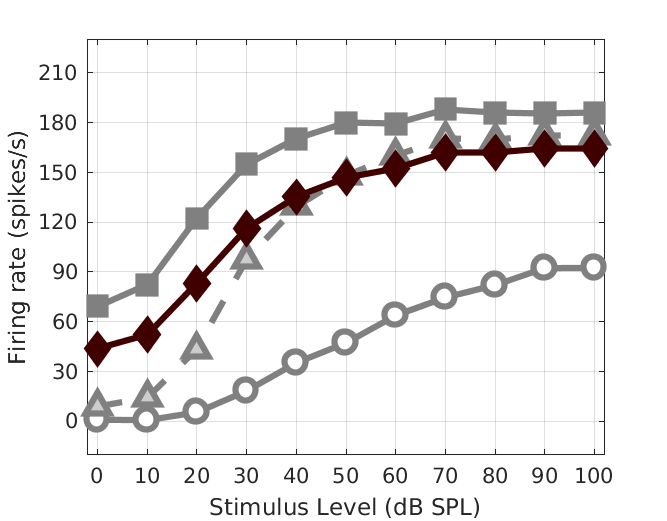
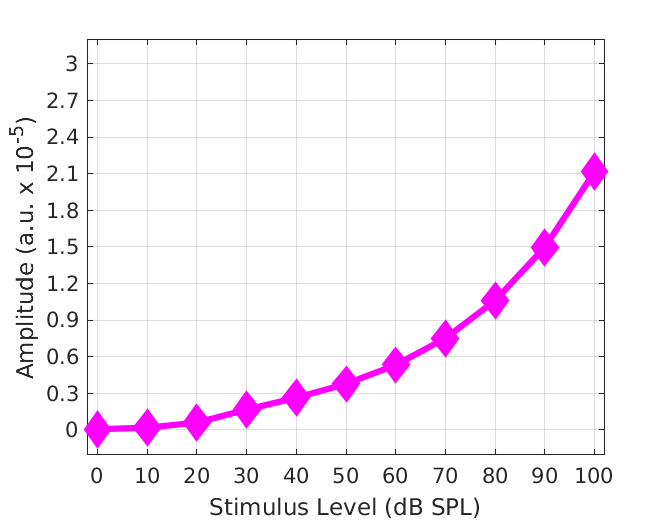
To display Fig. 10 of Osses et al., (2022) use :
out = exp_osses2022('fig10');
|
|
|
|
|
|
|
|
|
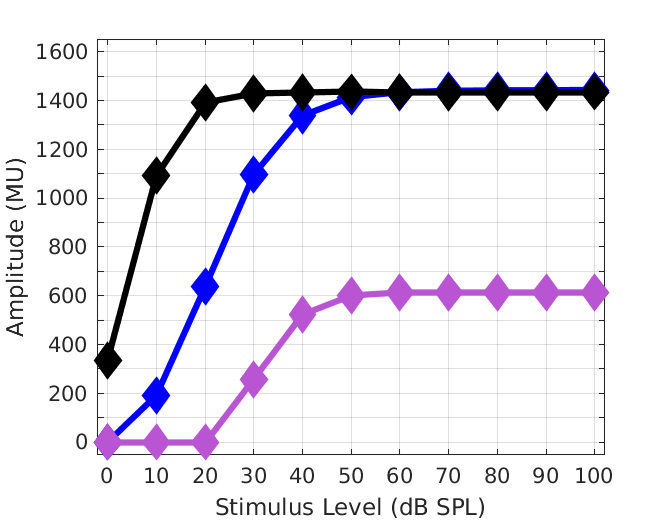
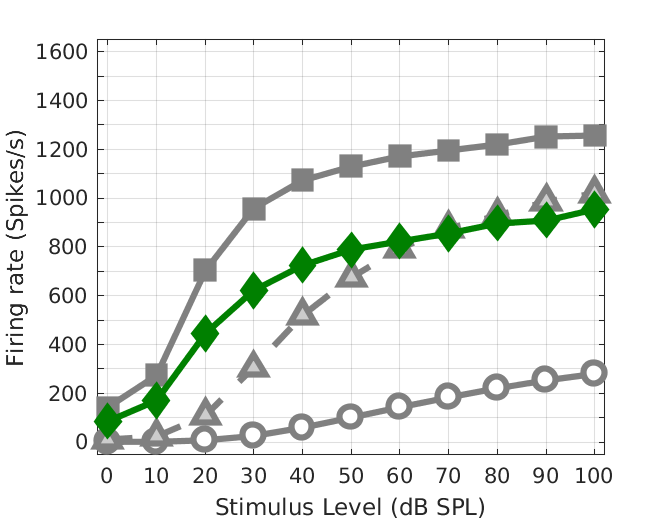
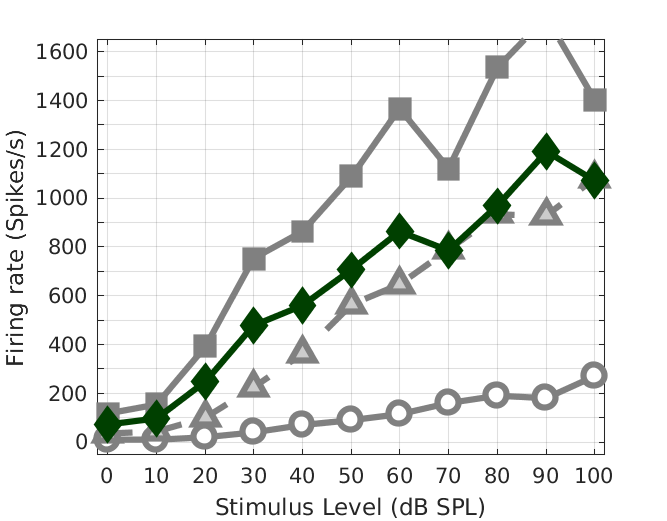
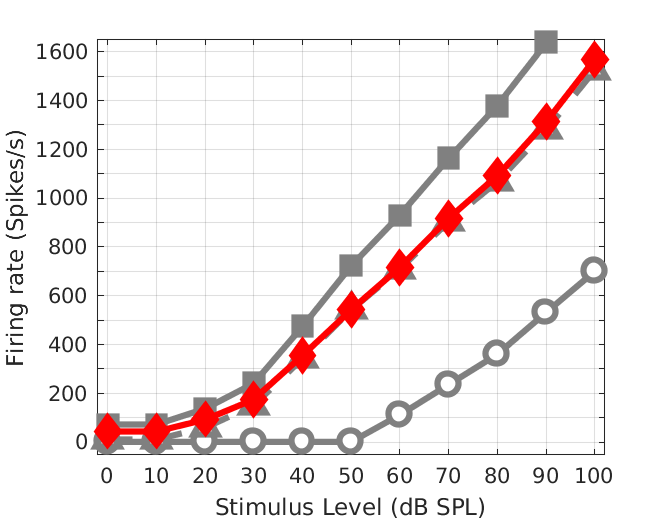
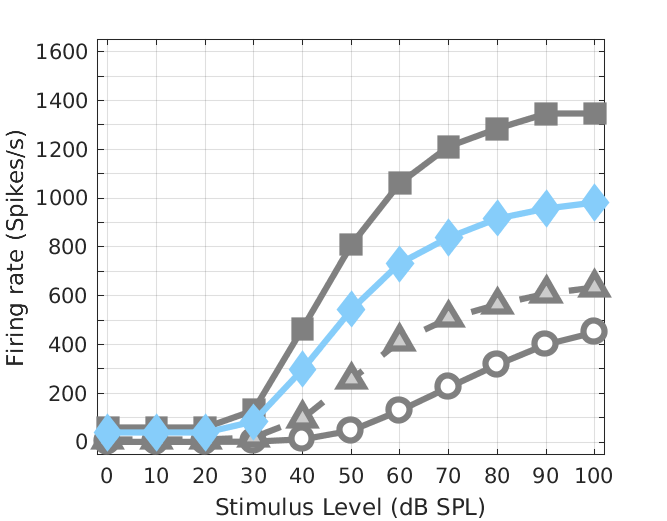
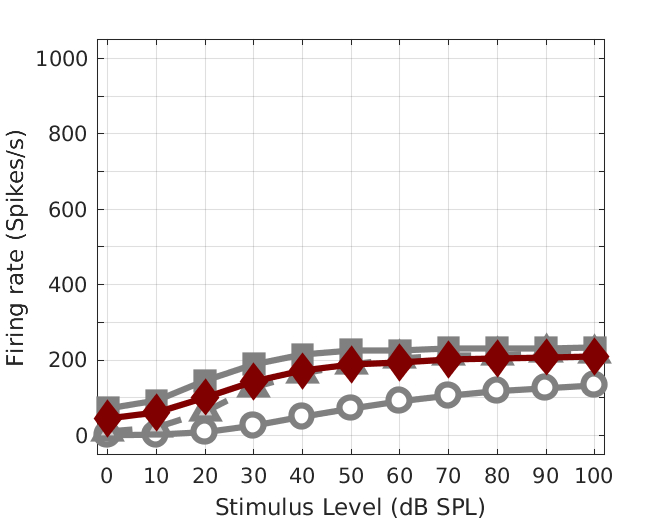
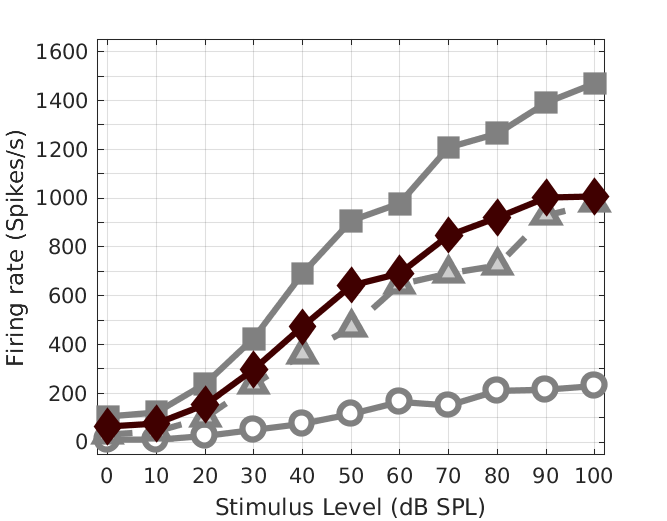
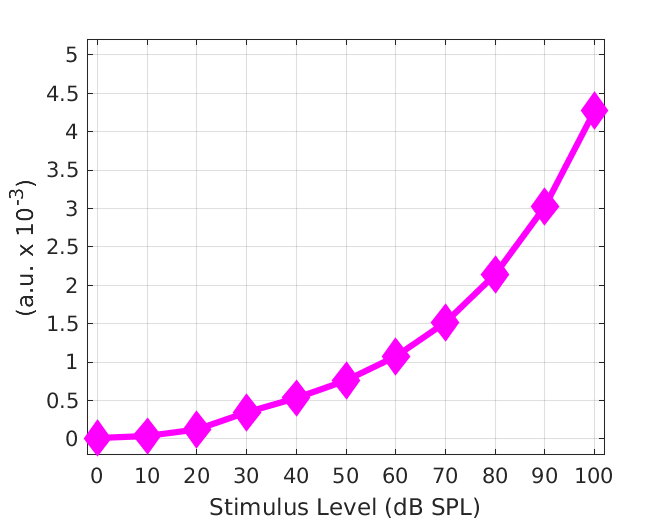
To display Fig. 11 of Osses et al., (2022) use :
out = exp_osses2022('fig11');
|
|
|
|
|
|
|
|
|
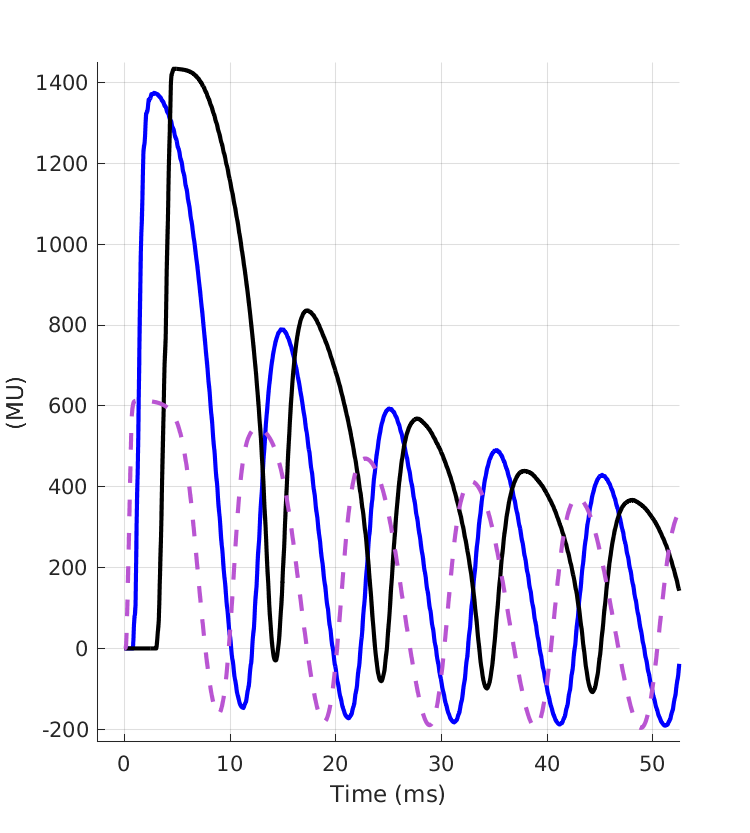
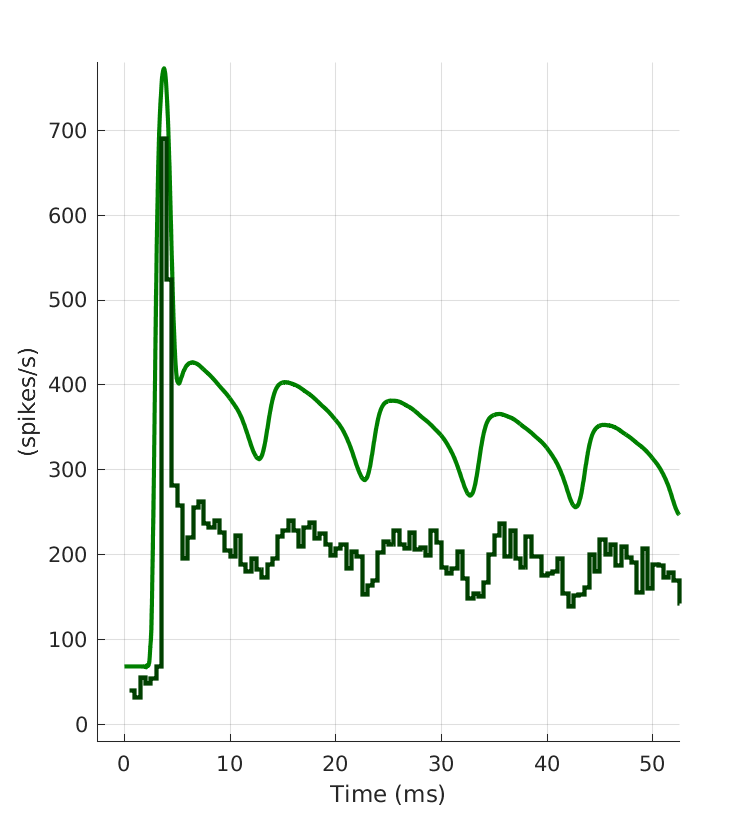
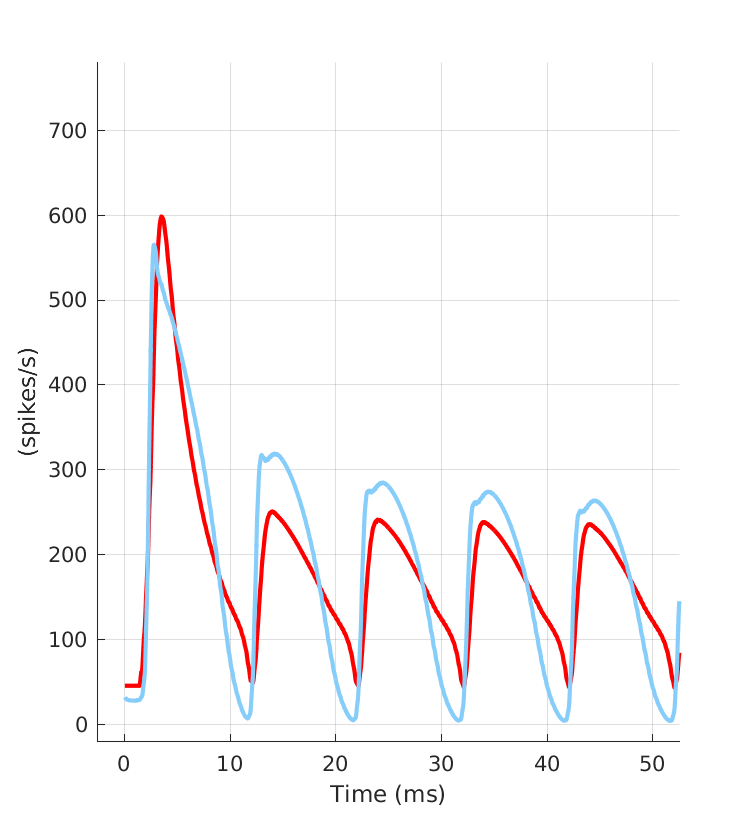
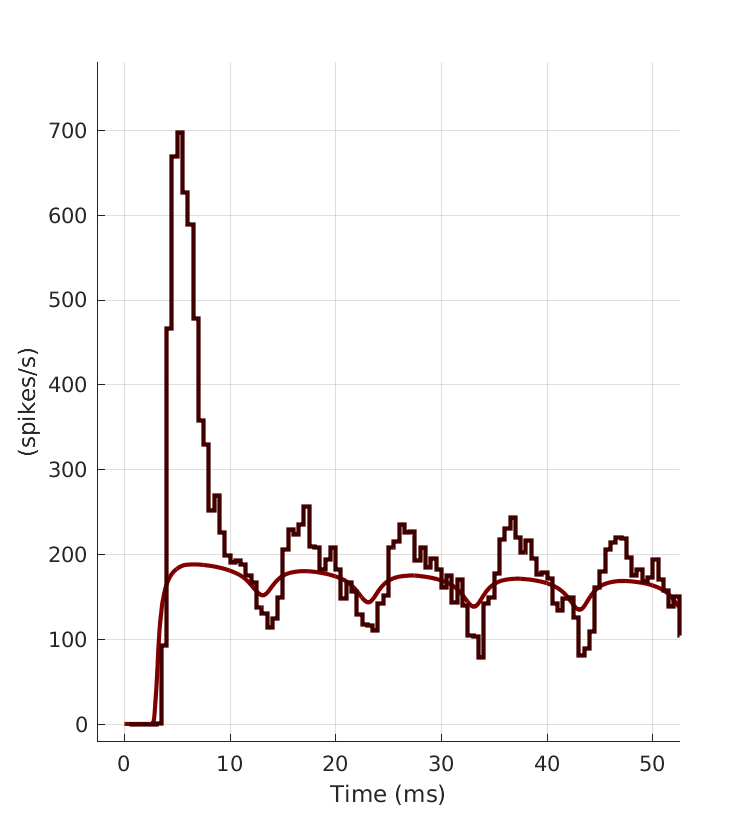
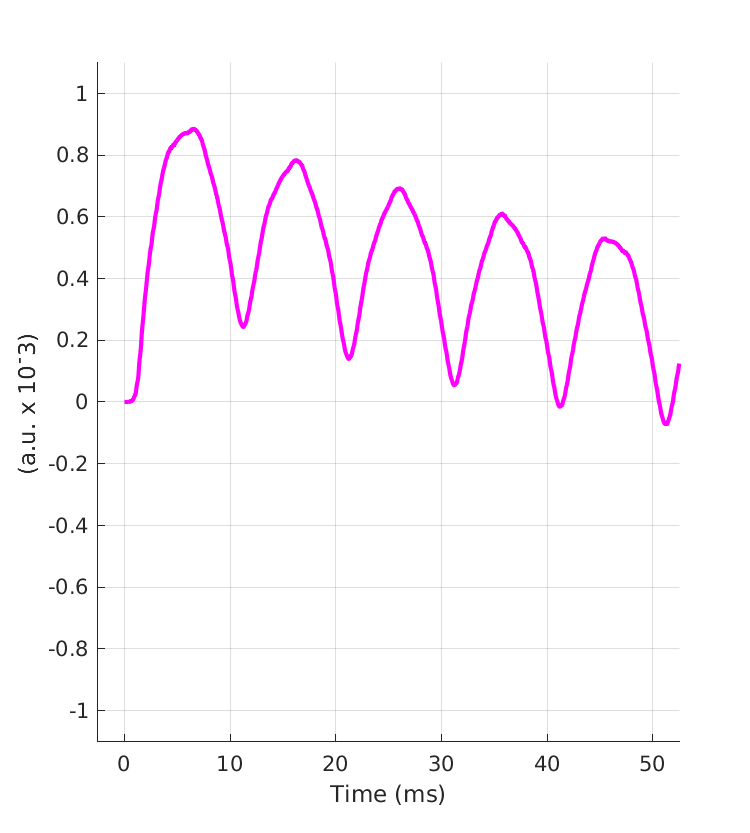
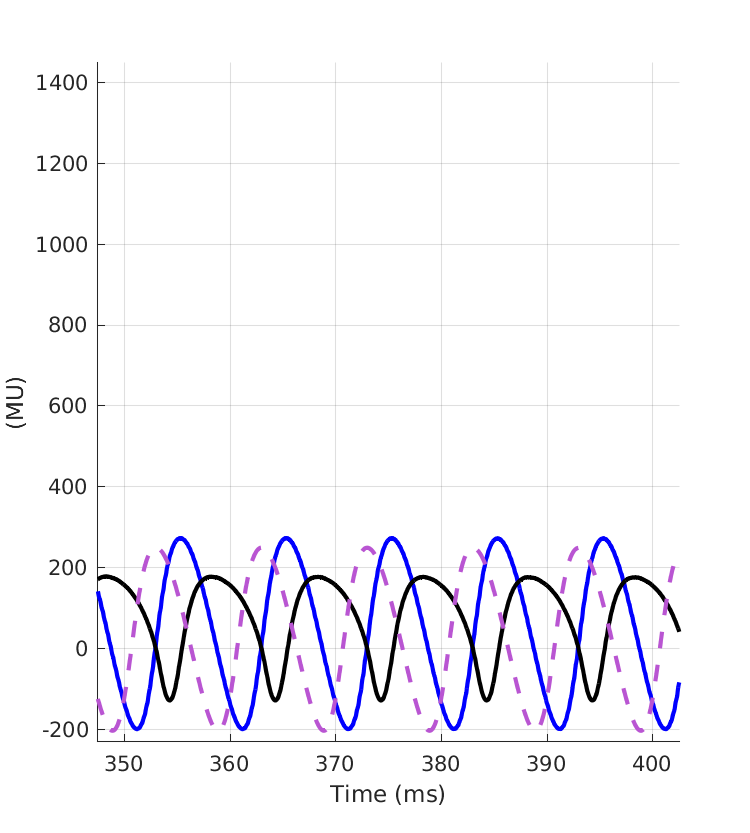
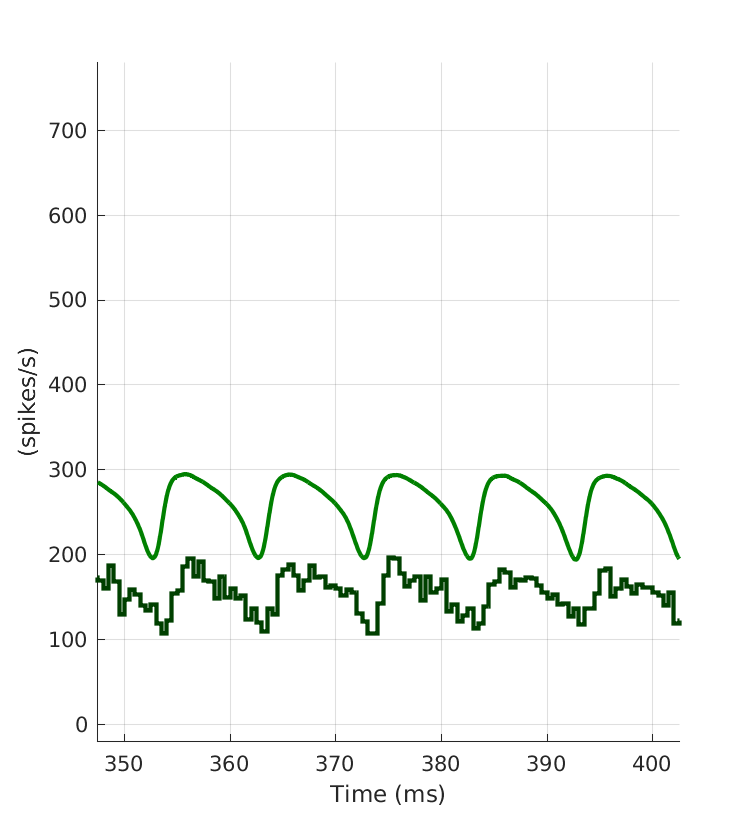
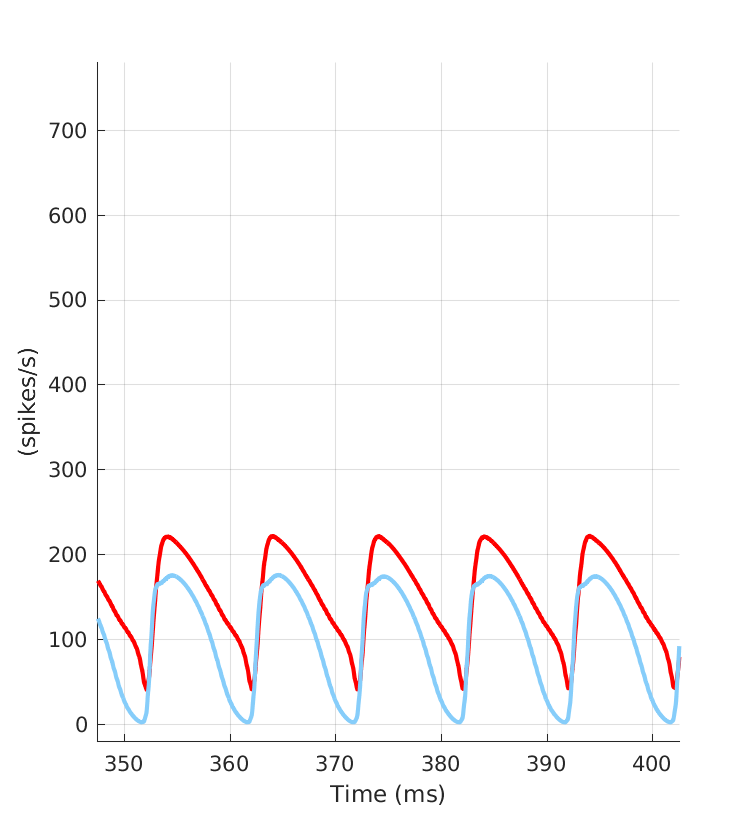
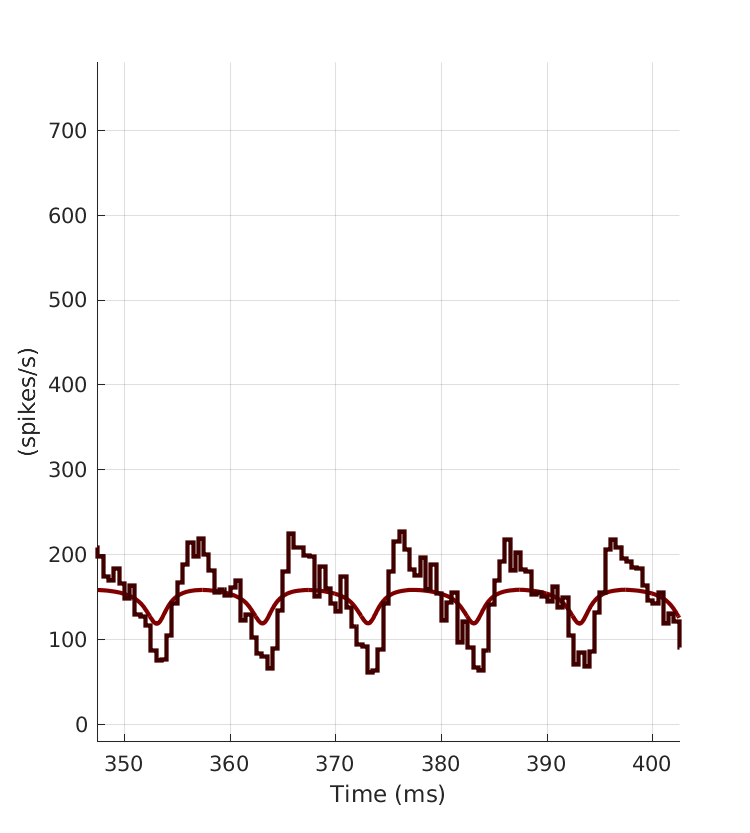
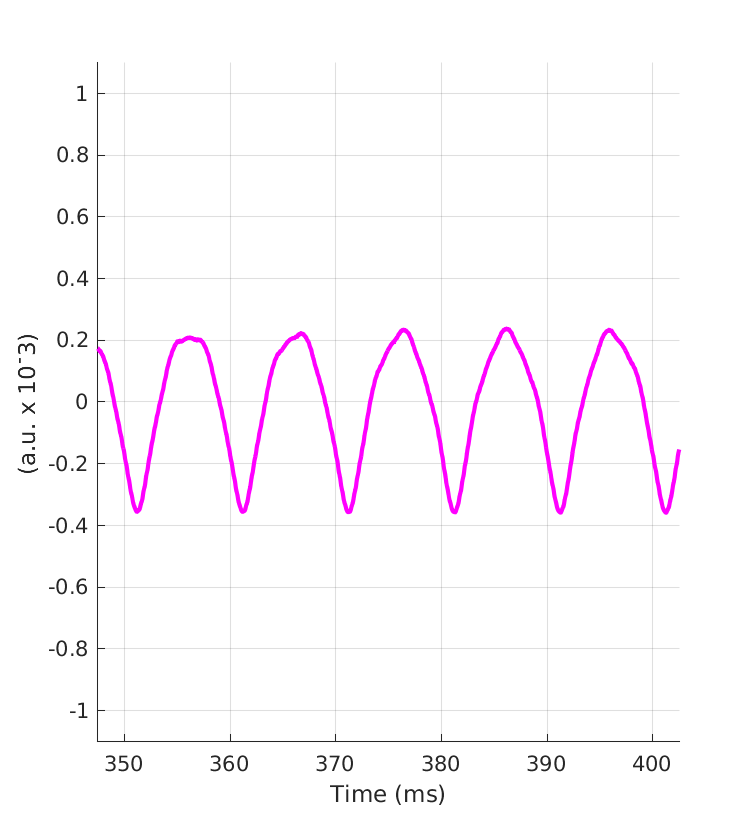
To display Fig. 12a or 12b of Osses et al., (2022) use :
out = exp_osses2022('fig12a');
out = exp_osses2022('fig12b');
|
|
|
|
|
|
|
|
|
|
|
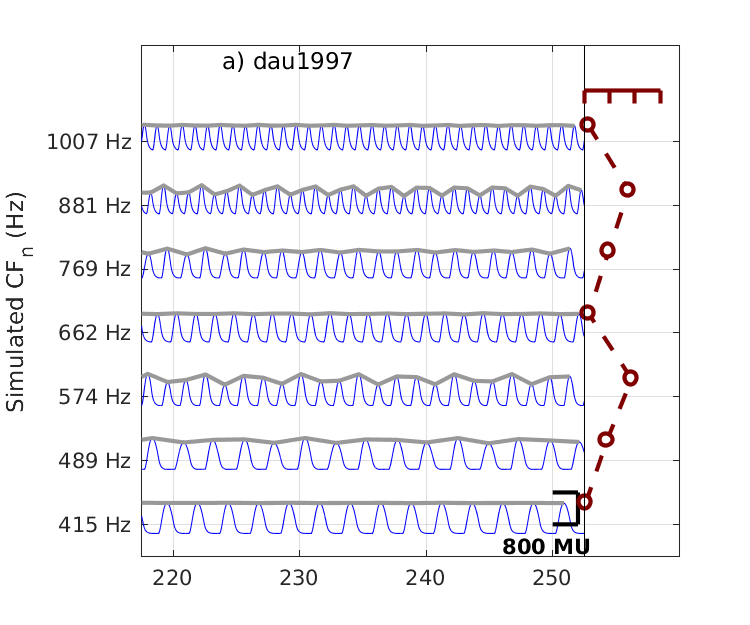
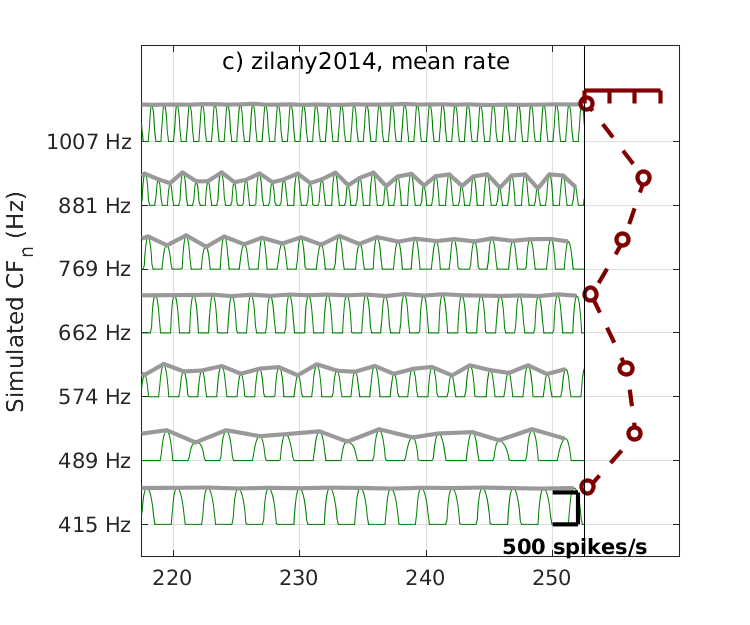
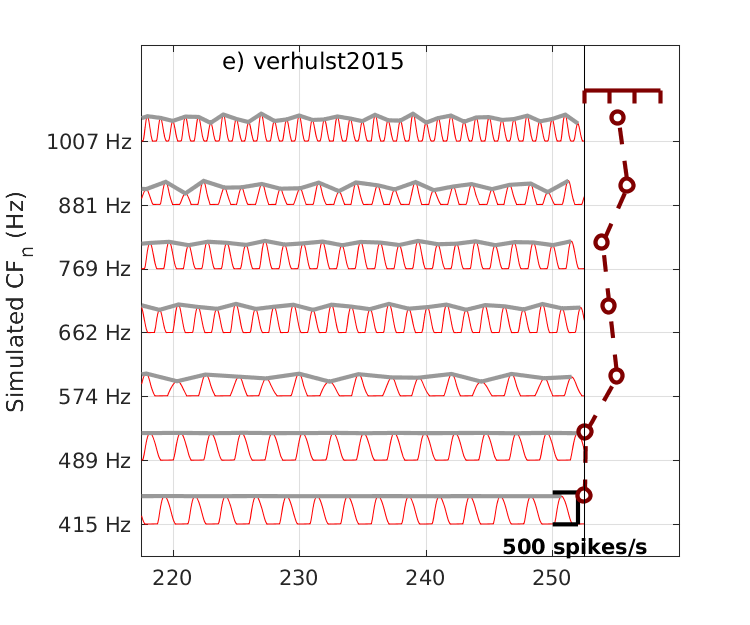
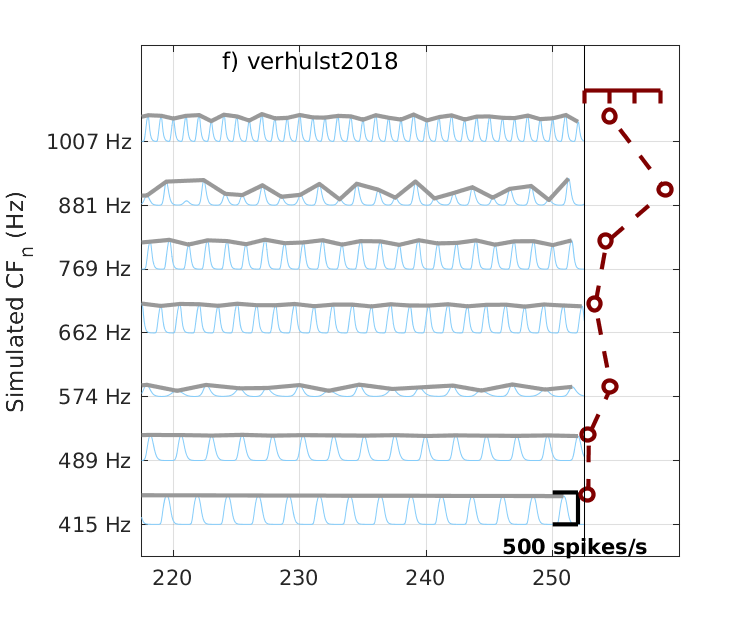
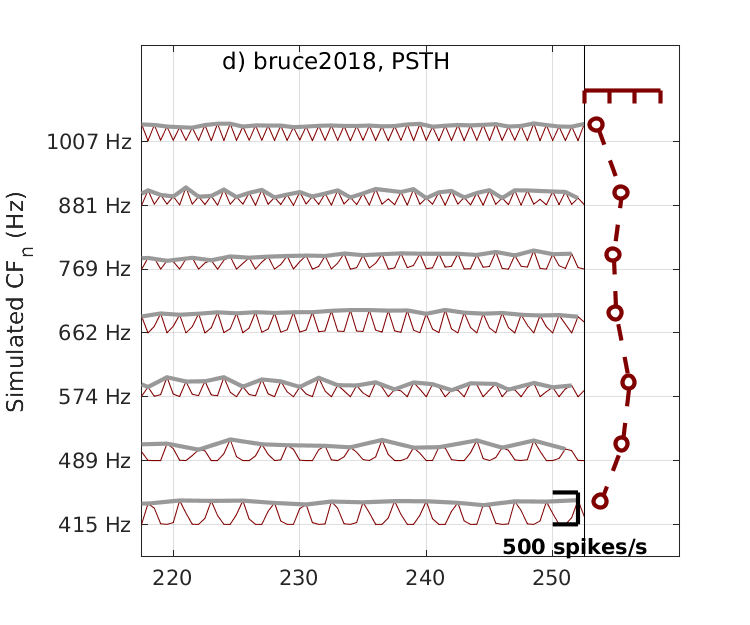
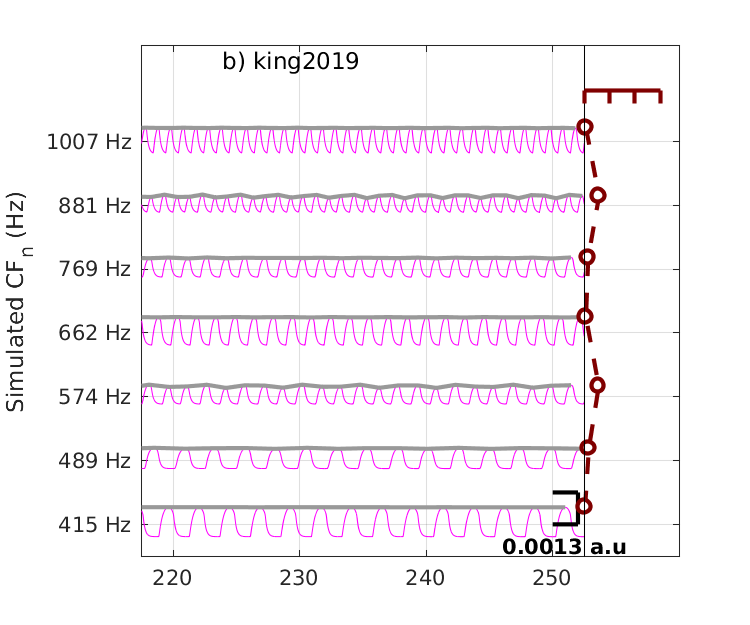
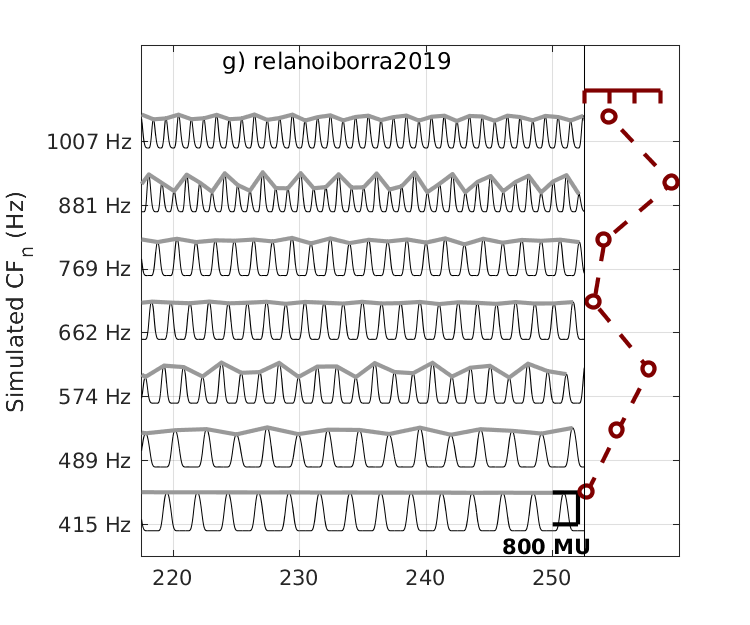
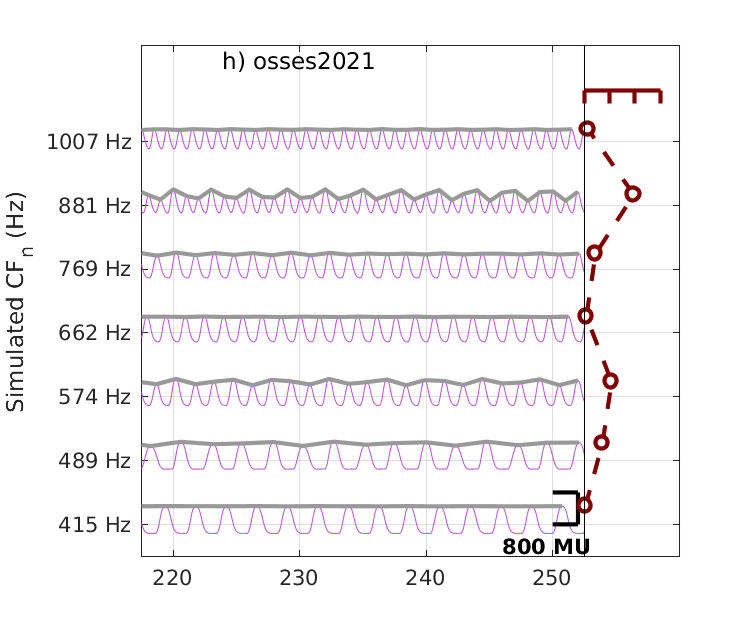
To display Fig. 13 of Osses et al., (2022) use :
out = exp_osses2022('fig13');
|
|
|
|
|
|
|
|
|
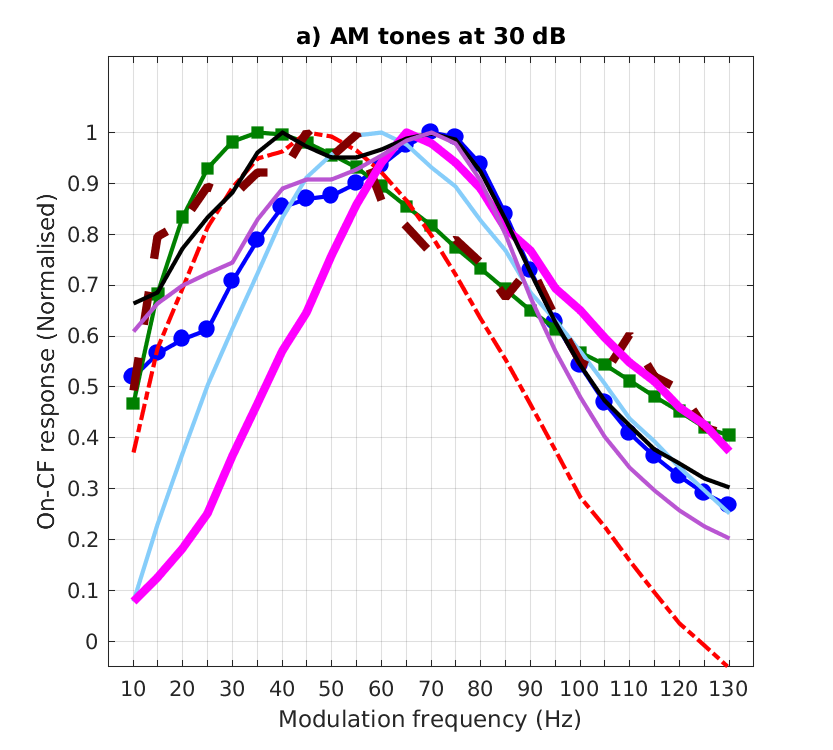
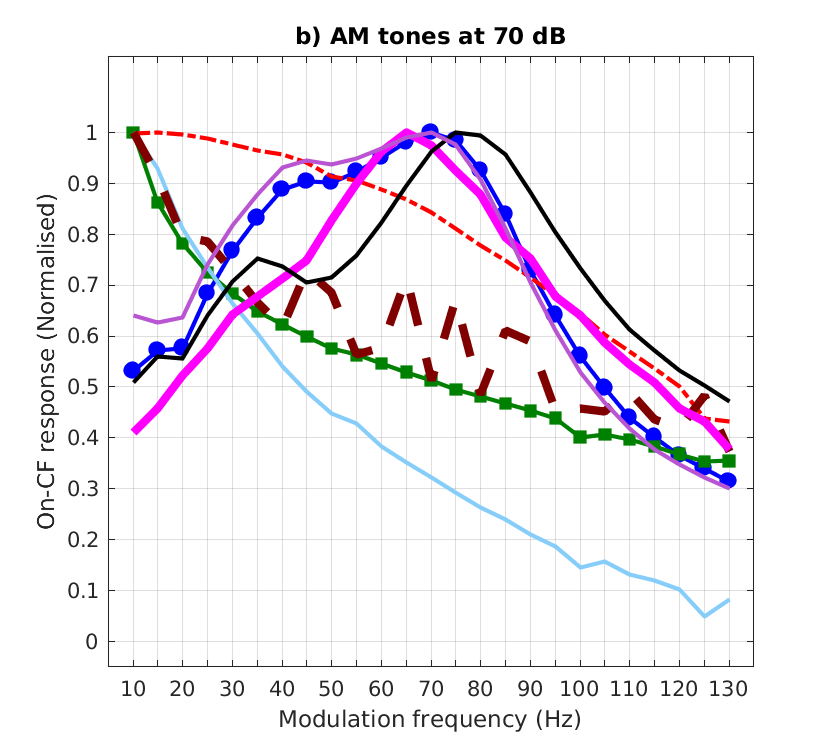
To display Fig. 14a or 14b of Osses et al., (2022) use :
out = exp_osses2022('fig14a');
out = exp_osses2022('fig14b');
|
|
|
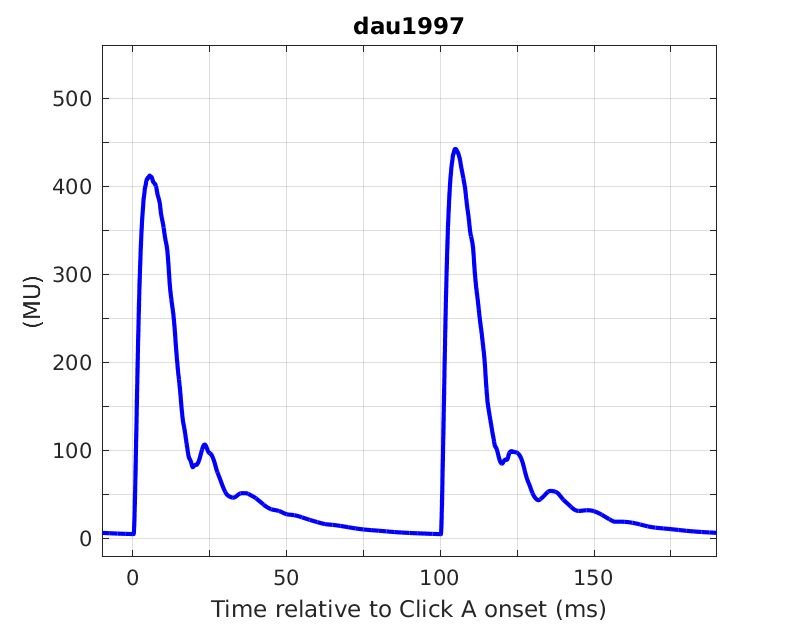
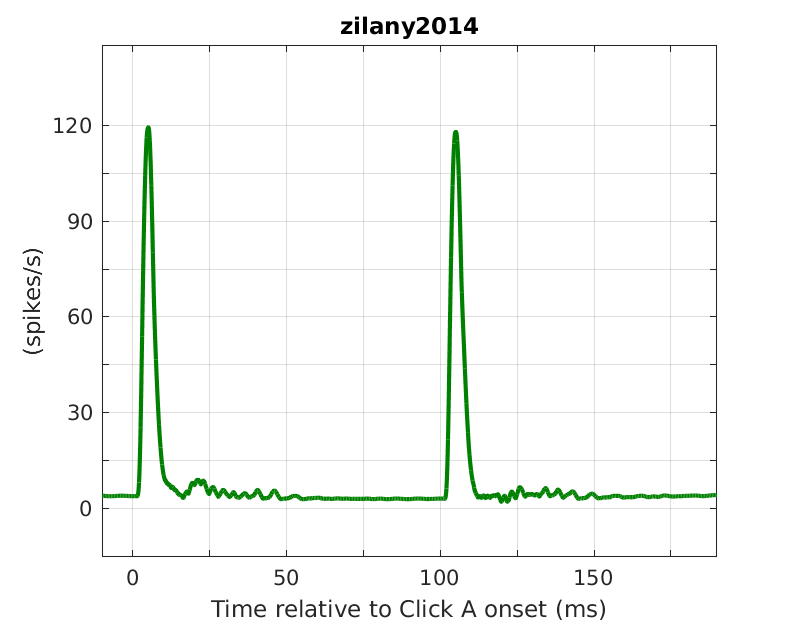
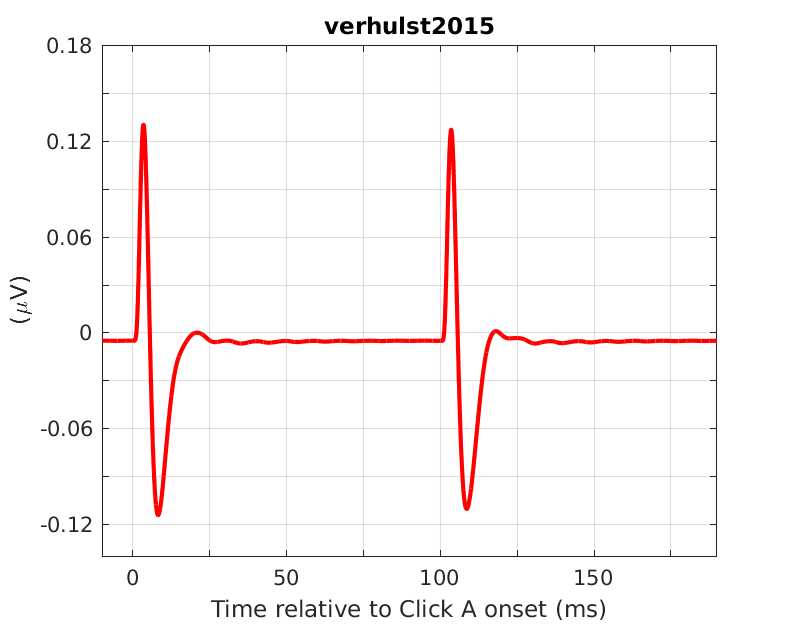
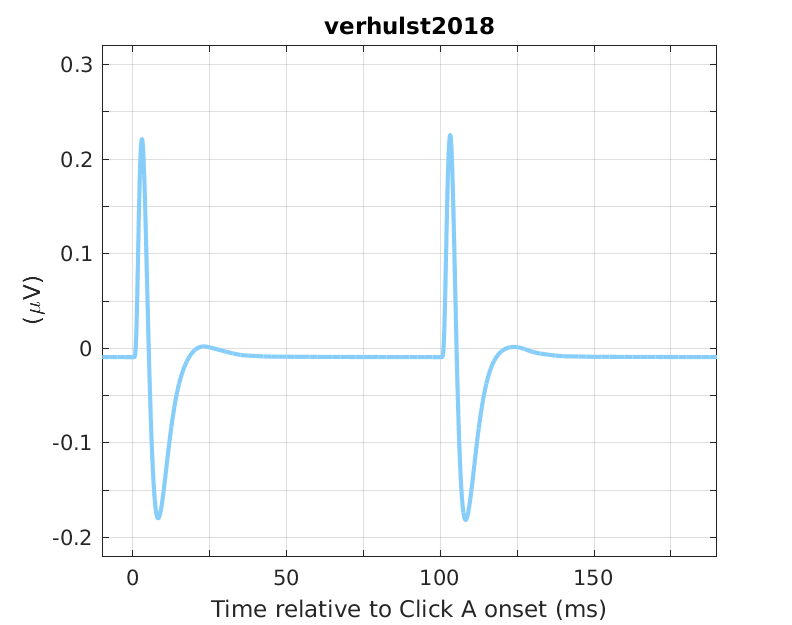
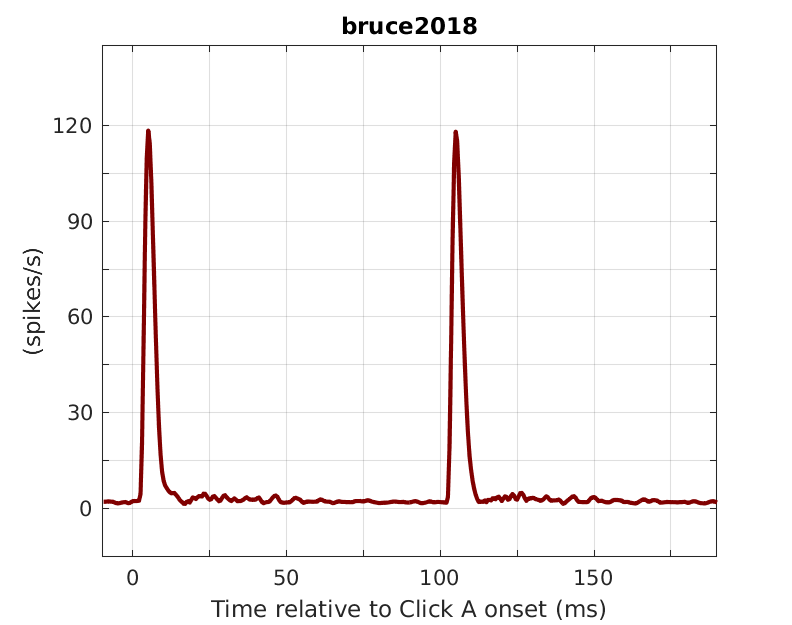
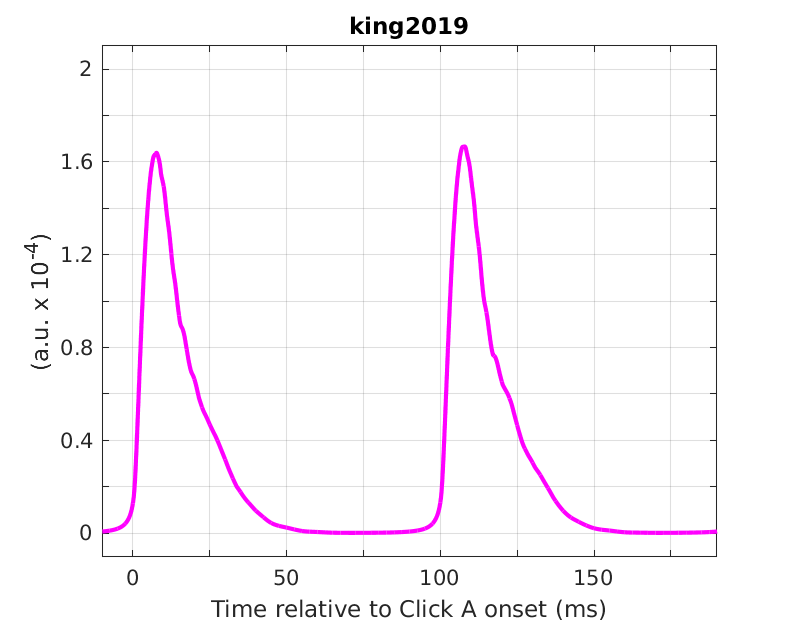
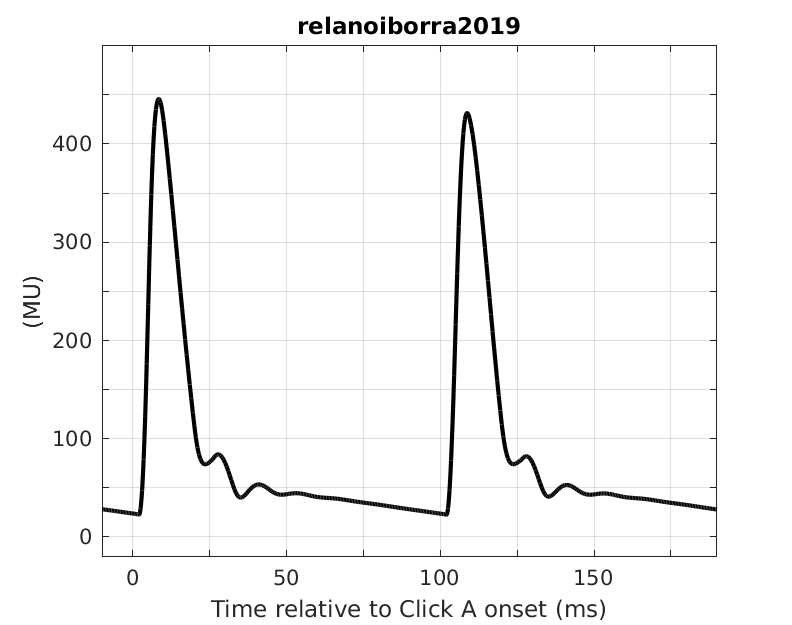
To display Fig. 15 of Osses et al., (2022) use :
out = exp_osses2022('fig15');
out = exp_osses2022('fig15','redo'); % example where the data are recomputed
|
|
|
|
|
|
|
|
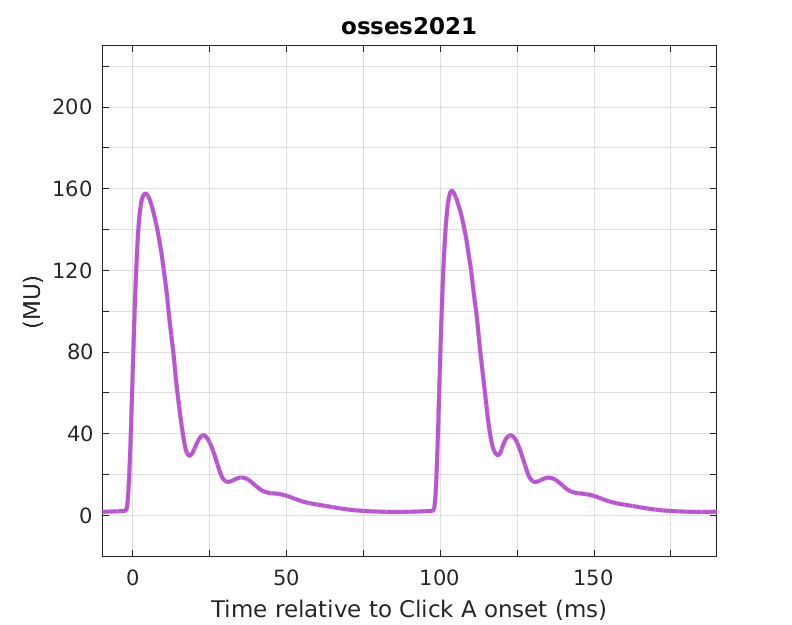
|
This code produces the following output:: Using Wave-V estimate only... Using Wave-V estimate only... Using Wave-V estimate only... Using Wave-V estimate only... Using Wave-V estimate only... Using Wave-V estimate only... Using Wave-V estimate only... Using Wave-V estimate only... |
References:
H. Relaño-Iborra, J. Zaar, and T. Dau. A speech-based computational auditory signal processing and perception model. The Journal of the Acoustical Society of America, 146(5), 2019. [ DOI ]
A. Osses and A. Kohlrausch. Perceptual similarity between piano notes: Simulations with a template-based perception model. The Journal of the Acoustical Society of America, 141(4), 2020.
A. King, L. Varnet, and C. Lorenzi. Accounting for masking of frequency modulation by amplitude modulation with the modulation filter-bank concept. The Journal of the Acoustical Society of America, 145(2277), 2019.
I. C. Bruce, Y. Erfani, and M. S. R. Zilany. A phenomenological model of the synapse between the inner hair cell and auditory nerve: Implications of limited neurotransmitter release sites. Hearing Research, 360:40--54, 2018. [ http ]
T. Dau, B. Kollmeier, and A. Kohlrausch. Modeling auditory processing of amplitude modulation. I. Detection and masking with narrow-band carriers. The Journal of the Acoustical Society of America, 102:2892--2905, 1997a.
M. S. A. Zilany, I. C. Bruce, and L. H. Carney. Updated parameters and expanded simulation options for a model of the auditory periphery. The Journal of the Acoustical Society of America, 135(1):283--286, Jan. 2014. [ DOI ]
S. Verhulst, H. Bharadwaj, G. Mehraei, C. Shera, and B. Shinn-Cunningham. Functional modeling of the human auditory brainstem response to broadband stimulation. The Journal of the Acoustical Society of America, 138(3):1637--1659, 2015.
S. Verhulst, A. Altoè, and V. Vasilkov. Functional modeling of the human auditory brainstem response to broadband stimulation. Hearing Research, 360:55--75, 2018.
A. Osses Vecchi, L. Varnet, L. H. Carney, T. Dau, I. C. Bruce, S. Verhulst, and P. Majdak. A comparative study of eight human auditory models of monaural processing. Acta Acustica, 6:17, 2022. Publisher: EDP Sciences. [ DOI ]


