THE AUDITORY MODELING TOOLBOX
This documentation page applies to an outdated AMT version (1.3.0). Click here for the most recent page.
Go to function
EXP_BISCHOF2023 - experiments from Bischof et al. 2023
Usage
[OUT_struct] = exp_bischof2023(flags)
Input parameters
| flags | string to reproduce specific figure from Bischof et al. (2023) ('fig3','fig4','fig7' or 'fig8') |
Output parameters
| OUT_struct | structure with all predicted SNRs, BMLDs and better ear SNRs for the experiment reported in Bischof et al. (2023). |
Description
EXP_BISCHOF2023 runs the model bischof2023 for DYNamic Binaural Unmasking (DynBU)with binaural recordings of the original stimuli used in the detection experiment and returns an output sturcture containing the model predictions as well as the experimental data for further analysis or plotting of the results.
The following flags can be specified
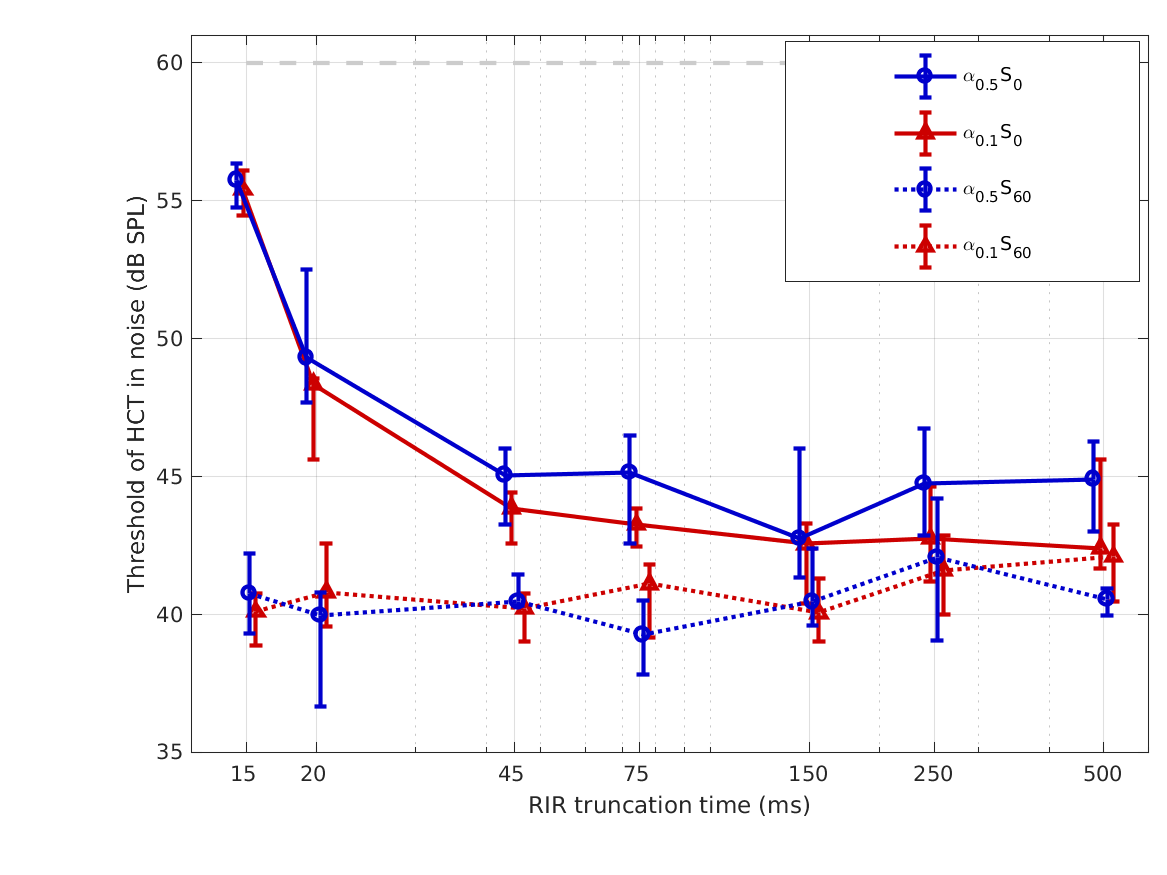
| 'fig3' | Reproduce Fig.3: Medians and quartiles of the measured binaural detection thresholds of a reverberant harmonic complex tone for different truncations of the room impule response in the presence of an anechoic bandpass noise with 60 dB SPL from the front. Solid lines indicate thresholds for a collocated target sound source at 0°, dashed lines for a target sound source at 60°. Data in blue correspond to measured thresholds with an absorption coefficient of 0.5, data in red for an absorption coefficient of 0.1. |
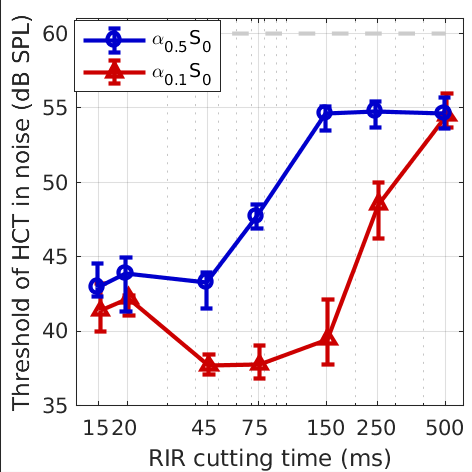
| 'fig4' | Reproduce Fig.4: Medians and quartiles of the measured binaural detection thresholds of a reverberant harmonic complex tone located at 0° for different time conditions of cut early reflections from the room impulse response in the presence of an anechoic bandpass noise with 60 dB SPL from the front. Data in blue correspond to measured thresholds with an absorption coefficient of 0.8, data in red for an absorption coefficient of 0.1. |
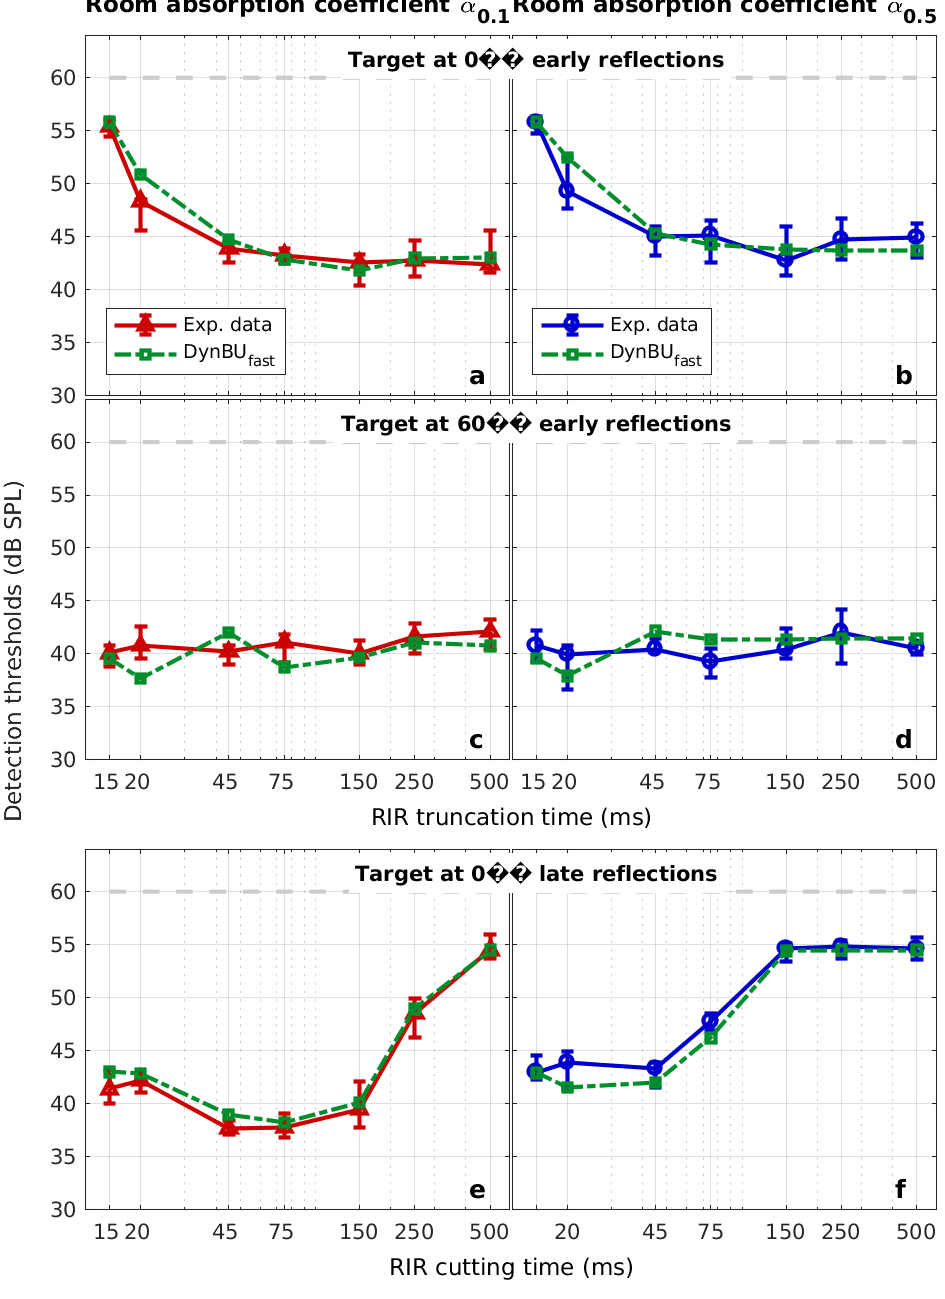
| 'fig7' | Reproduce Fig.7: Predictions of bischof2023 are shown with green squares connected with dashed lines along with measured thresholds reported in Figure 3 and Figure 4. The left column shows data for an absorpiton coefficient of 0.1, the right column for an absorption coefficient of 0.5 respectively. The first row refers to data with a collocated target and noise at 0°, the second row for a target at 60° and a noise masker at 0°, both for different truncations of the room impule response. The thirs row refers to data with a collocated target and noise at 0° for different time conditions of cut early reflections from the room impulse response. |
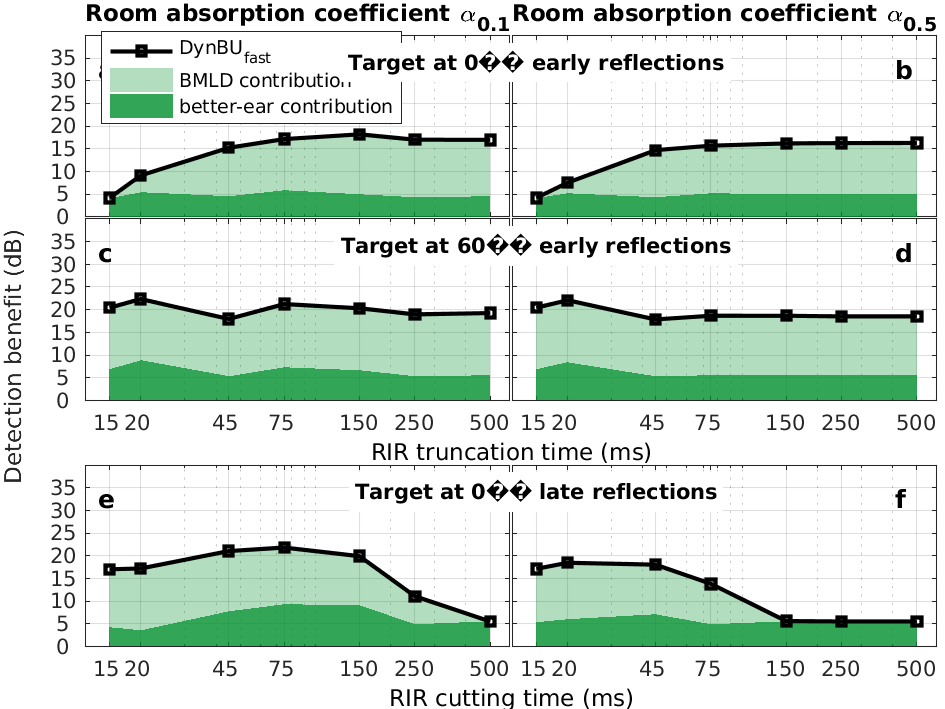
| 'fig8' | Reproduce Fig.8: Contributions of better-ear SNR (dark green shaded area) and BMLD (light green shaded area) to the overall predicted binaural benefit using bischof2023. The overall prediction is ploted as detection benefit for all different experimental conditions shown in Figure 7. The division of the individual panels corresponds to that in Figure 7. |
Examples:
To display Fig.3 use
exp_bischof2023('fig3');

To display Fig.4 use
exp_bischof2023('fig4');

To display Fig.7 use
exp_bischof2023('fig7');

To display Fig.8 use
exp_bischof2023('fig8');

References:
N. Bischof, P. Aublin, and B. Seeber. Fast processing models effects of reflections on binaural unmasking. Acta Acustica, 2023.


