THE AUDITORY MODELING TOOLBOX
This documentation page applies to an outdated AMT version (1.5.0). Click here for the most recent page.
Go to function
EXP_STEIDLE2019 - Compares various ITD calculation methods
Usage:
exp_steidle2019(flag)
Description:
The following flags can be chosen:
| 'clean' | clean data |
| 'noisy' | noisy data |
| 'stim' | to create the data which was used |
| 'figure' | to create the plots shown in the paper (fig1,...`fig9`) |
| 'lowpass' | (optional) Decide if lowpass shall be applied. lp for lowpass (default), bb for broadband |
| 'threshlvl' | (optional) Set threshold level for 'Threshold mode in dB. Default is -10 dB. |
Requirements:
- SOFA API from http://sourceforge.net/projects/sofacoustics for Matlab (in e.g. thirdparty/SOFA)
Examples:
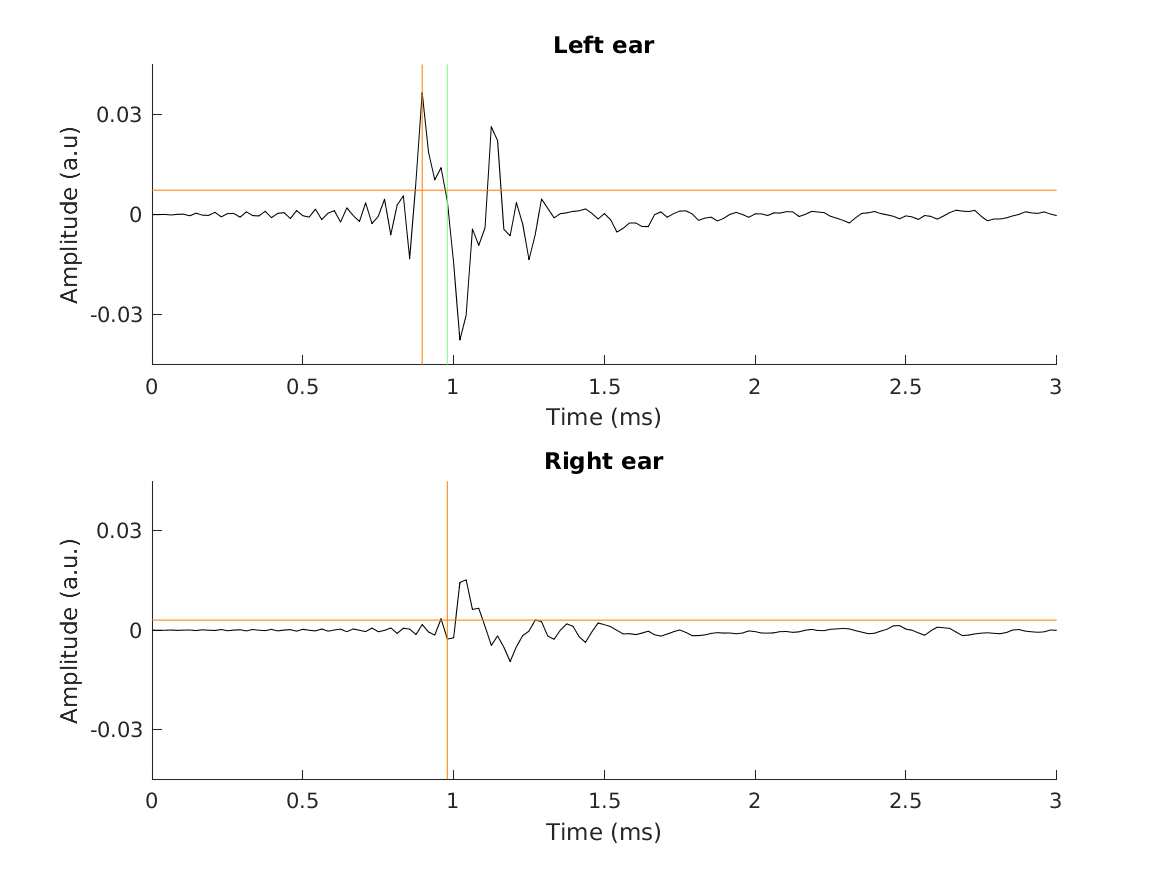
To display results for Fig.1 use :
exp_steidle2019('fig1');
|

|
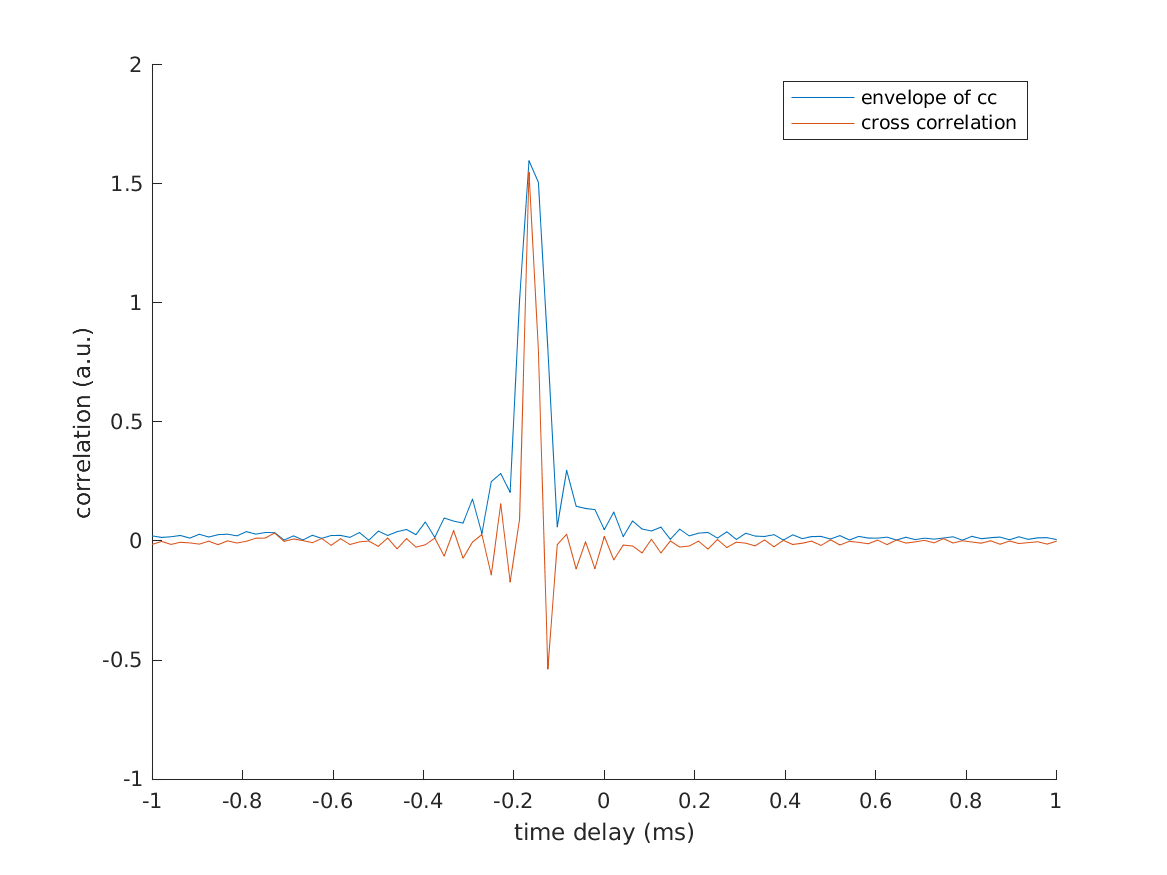
To display results for Fig.2 use :
exp_steidle2019('fig2');
|

|
To recalculate the data sets use i.e. :
exp_steidle2019('clean','lp');
|
References:
L. Steidle and R. Baumgartner. Geometrical evaluation of methods to approximate interaural time differences by broadband delays. In Proceedings of the German Annual Meeting (DAGA), Rostock, DE, Mar 2019. [ .pdf ]


