THE AUDITORY MODELING TOOLBOX
Go to function
DATA_NEELY1988
ABR wave V data as functon of level and sweeping rate
Usage:
tau = data_neely1988(flag)
Input parameters:
| F | Centre frequencies of stimulus |
| L | Levels at centre frequencies |
Output parameters:
| tau | Wave V latency |
Description:
data_neely1988(F,L) returns data points based on equation 1 from Neely et al. (1988) where F is the centre frequencies and L are the associated levels.
The flag may be one of:
| 'no_plot' | Don't plot, only return data. This is the default. |
| 'plot' | Plot the data. |
Examples:
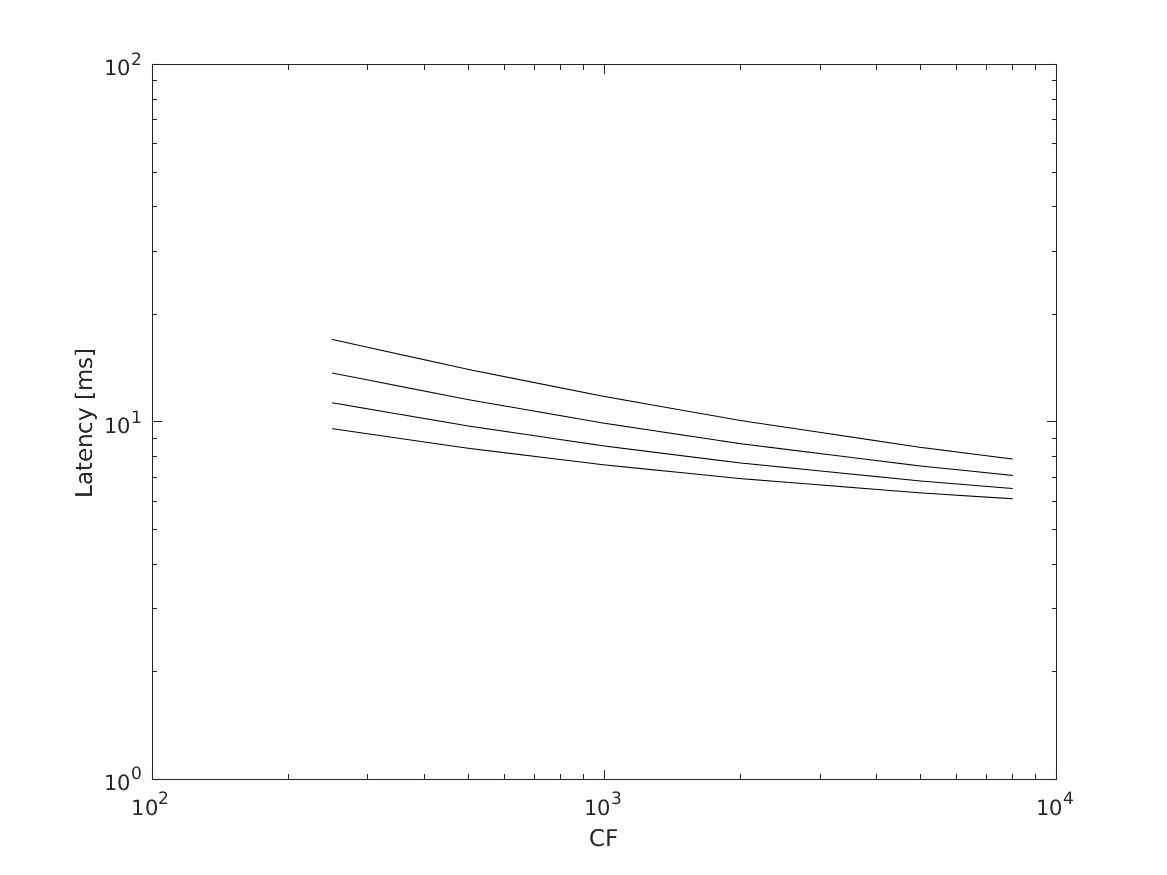
Figure 2 in Neely et al. (1988) can be reproduced using:
F=[250 500 1000 2000 5000 8000];
tau=data_neely1988(F,[40 60 80 100]);
loglog(F,tau','k-');
xlabel('CF');
ylabel('Latency [ms]')
|
|
References:
S. Neely, S. Norton, M. Gorga, and J. W. Latency of auditory brain-stem responses and otoacoustic emissions using tone-burst stimuli. The Journal of the Acoustical Society of America, 83(2):652--656, feb 1988.


Build with Bootstrap