THE AUDITORY MODELING TOOLBOX
Go to function
DEMO_DAU1997
Demo of the auditory model of Dau, Kollmeier, and Kohrausch (1997)
Description:
This script estimates the internal representations of a pure tone with and without a sinusoidal amplitude modulation, and plots two modulation frequency bands for the band centred at 5 kHz. The simulations are run using the model default parameters.
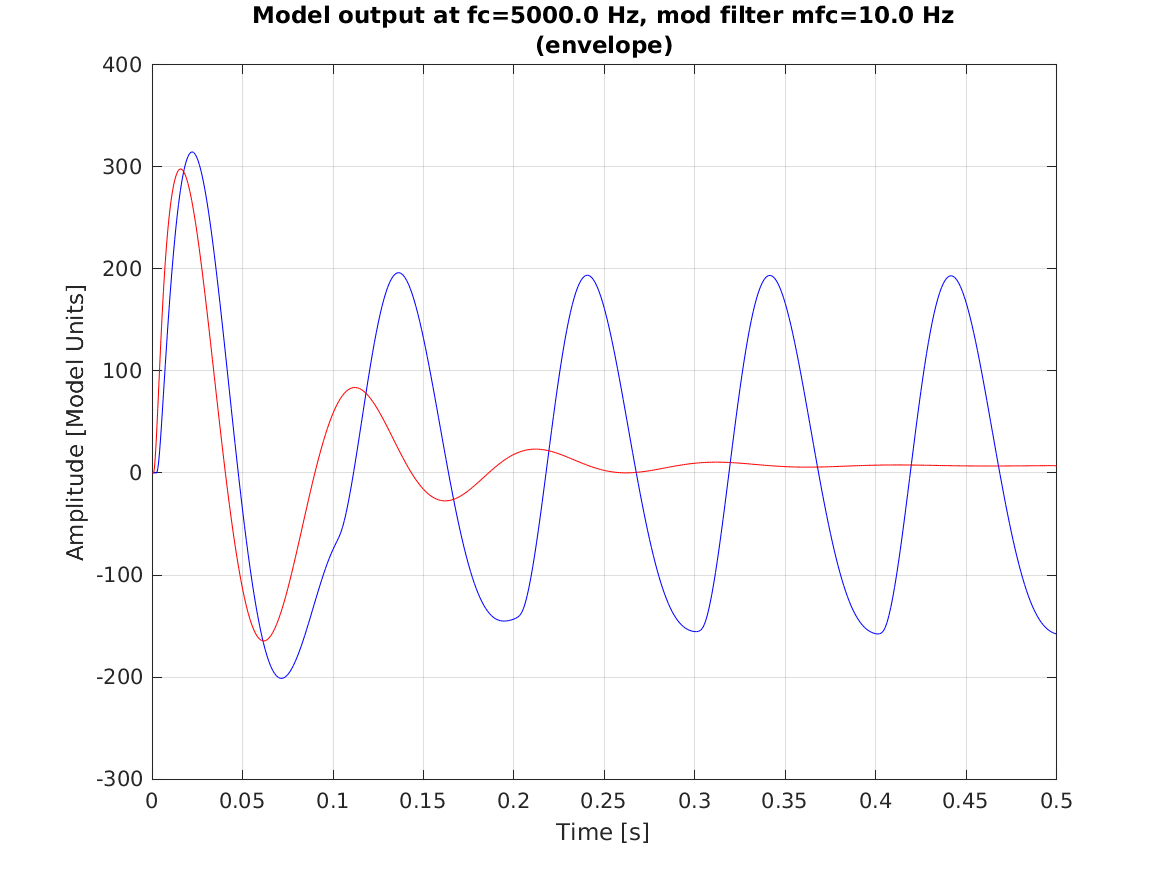
The above figure shows the model output at 5 kHz for the modulation filter centred at 10 Hz.
This time signal corresponds to the 'venelope' post-processing,
which keeps the Hilbert envelope of the modulation filter (similar
for other modulation bands with mfc>=10 Hz).
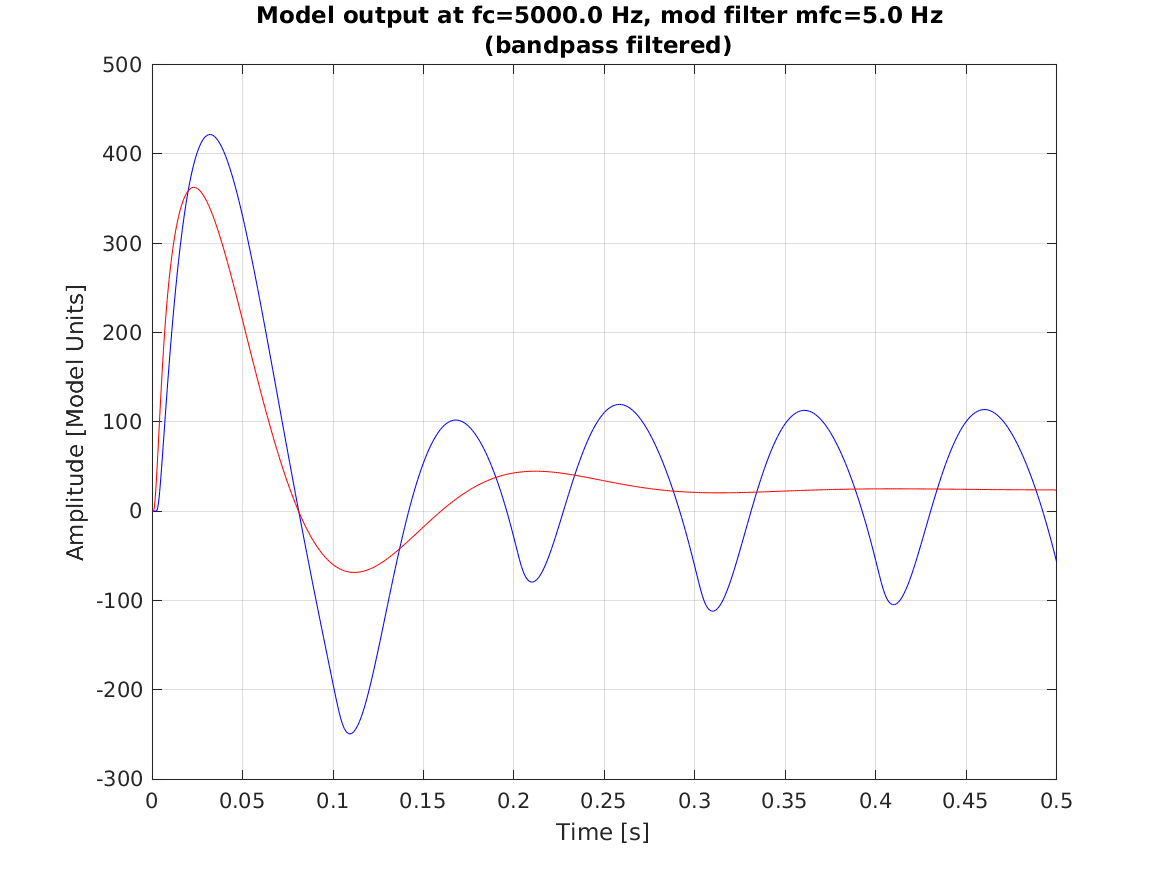
The above figure shows the bandpass-filtered output at 5 kHz for the modulation filter centred at 5 Hz.
This time signal corresponds to the band-passed modulation
signal. The same processing is adopted by the model for modulation
bands such that mfc>2.5 Hz and mfc<10 Hz.


Build with Bootstrap