THE AUDITORY MODELING TOOLBOX
Go to function
EXP_PAUSCH2022
- Reproduce the figures from Pausch et al. (2022)
Usage:
exp_pausch2022(fig)
Description:
The fig flag may be one of:
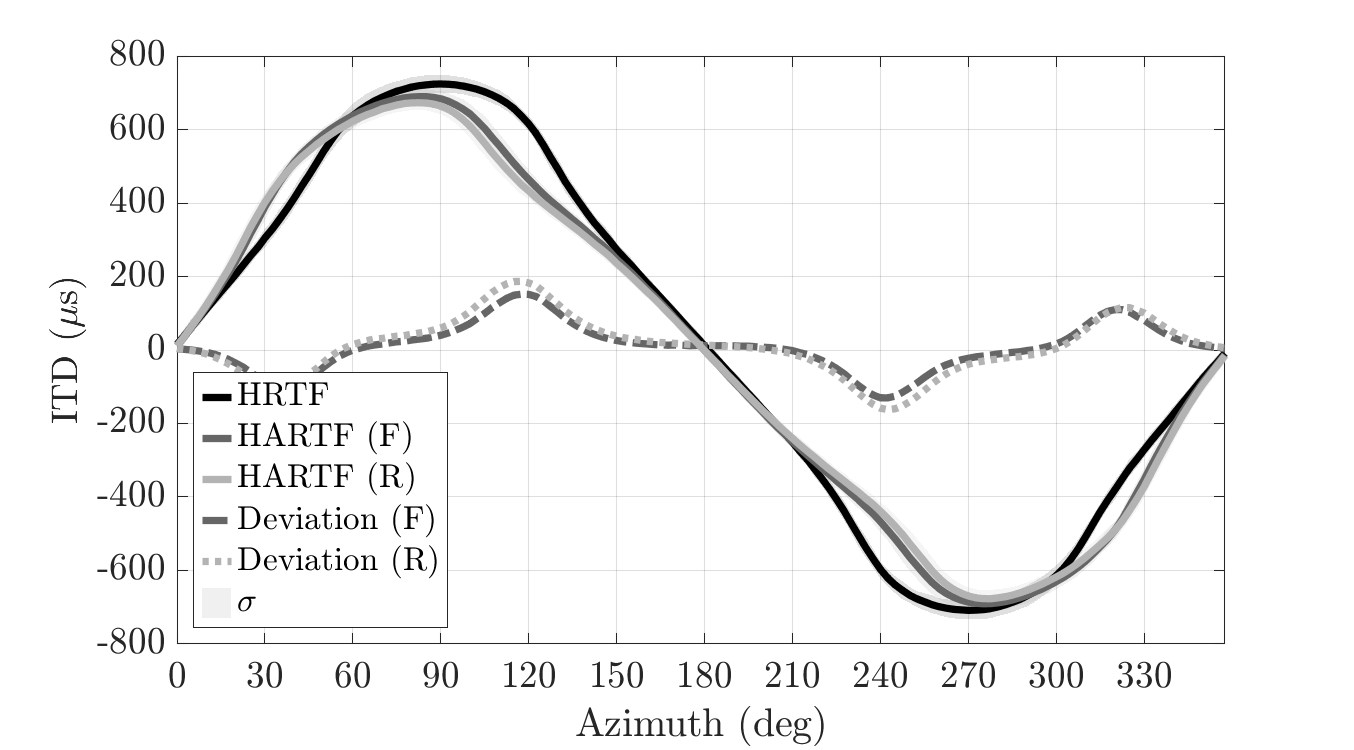
| 'fig5' | : Comparison of measurement-based mean ITDs between datasets in the horizontal plane, evaluated in a frequency range of 0.5-1.5 kHz and averaged across participants with standard deviations sigma (grey areas). Dashed and dotted lines show the mean ITD differences in front (F) and rear (R) HARTFs, respectively, compared to the mean ITDs in HRTFs. scenarios, represent differences to scenario A. |
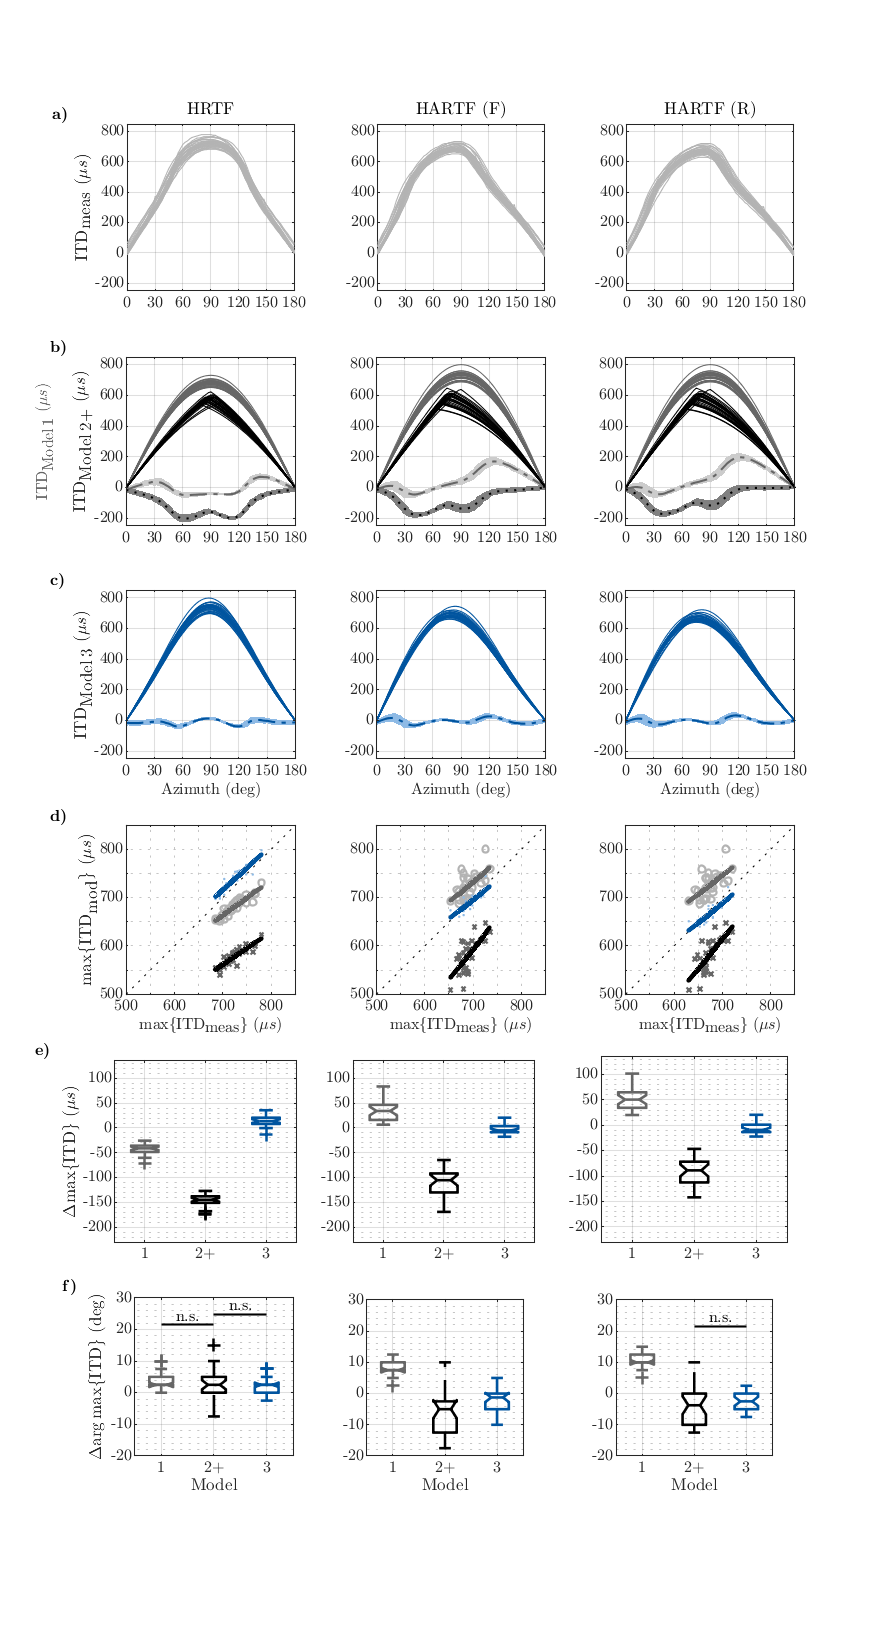
| 'fig9' | : a) Measurement-based (light grey) and b), c) model-based broadband ITD estimations, colour-coded in grey, black and blue, respectively, evaluated for directions in the horizontal plane for HRTF and front (F) and rear (R) HARTF datasets. Deviations from measurement- based ITDs are shown as dashed-dotted (Models~1 and~3) or dotted lines (Model~2+), with standard deviations as shaded areas. d) Scatter plots comparing measurement- based and model-based ITD maxima, fitted by linear regression lines. Box plots show medians and IQRs of differences in e) ITD maxima and f) arguments of the ITD maxima, with whiskers covering 1.5 times the IQR, and outliers displayed as crosses. Horizontal black lines indicate non-significant (n.s.) mean differences at the 95% confidence level. |
Requirements:
- SOFA Toolbox v0.4.3 or higher from http://sourceforge.net/projects/sofacoustics for Matlab (in e.g. thirdparty/SOFA)
- Data in auxdata/pausch2022 (downloaded on the fly)
Examples:
To display results of Fig. 5:
exp_pausch2022('fig5','plot');
|

|
To display results of Fig. 9:
exp_pausch2022('fig9');
|

|
References:
F. Pausch, S. Doma, and J. Fels. Hybrid multi-harmonic model for the prediction of interaural time differences in individual behind-the-ear hearing-aid-related transfer functions. Acta Acust., 6:34, 2022. [ DOI ]


